
Introduction
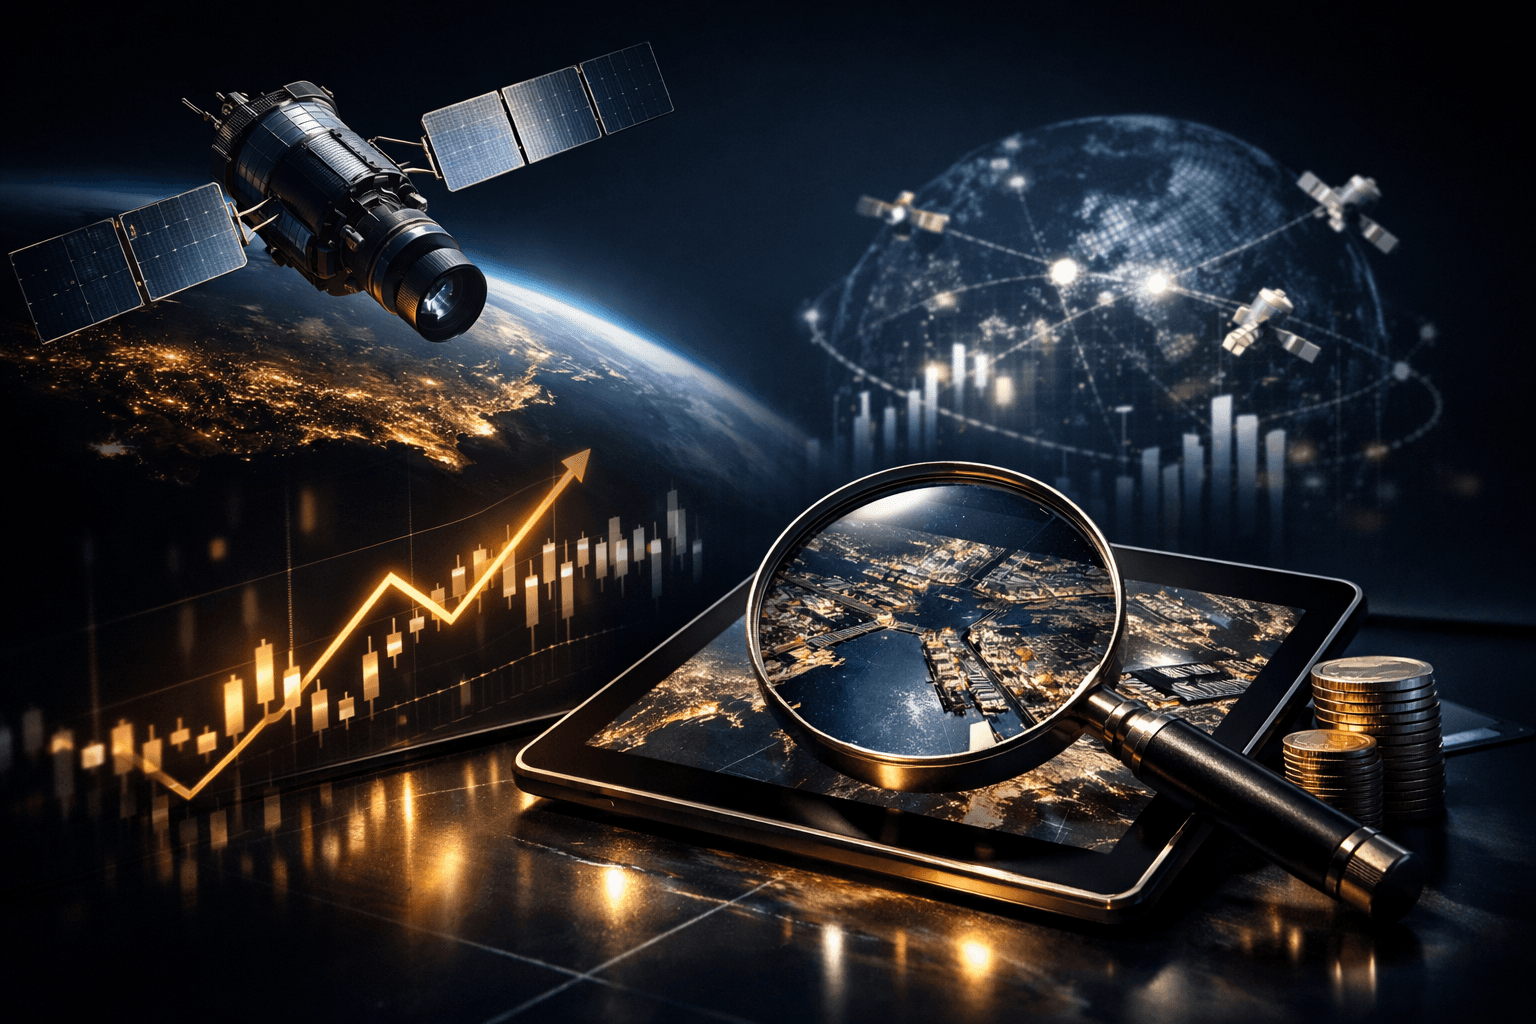
Satellite data for stock analysis means using imagery and derived geospatial signals gathered from orbiting sensors to inform investment hypotheses. This includes optical images, synthetic aperture radar, thermal maps, and derived indices like NDVI that reveal activity on the ground. You can use these signals to estimate store traffic, monitor supply chain movement, measure commodity stockpiles, or track construction progress.
This matters because alternative, non-financial data can give you earlier or orthogonal insight compared to traditional disclosures. Do you want a faster read on retail demand than quarterly sales alone? Or better visibility into global oil inventories than weekly reports? Satellite and geospatial data can answer those questions if you set up a robust workflow.
In this article you will learn data sources and their limits, practical analysis workflows, machine learning methods commonly used, and real-world examples with companies and commodities. You will also see common pitfalls and how to integrate satellite signals into your investment process.
- Satellite data provides leading, independent signals for store traffic, inventories, commodity stockpiles, and logistics flows.
- Choose sensors by tradeoffs: spatial resolution, revisit frequency, spectral bands, and cost determine fit for purpose.
- Key analytical steps include hypothesis definition, preprocessing, feature engineering, model validation, and backtesting.
- Common use cases include parking lot counts for retail, NDVI for crop yield, SAR for ship and oil storage monitoring, and thermal for power generation.
- Avoid pitfalls like overfitting, survivorship bias, geolocation errors, and ignoring latency or data licensing constraints.
How Satellite Data Works and Why It’s Useful
Satellite sensors collect electromagnetic data at different wavelengths and resolutions. Optical sensors capture visible and near-infrared light useful for photography and vegetation indices. Synthetic aperture radar or SAR uses microwaves so you can see through clouds and at night. Thermal sensors capture heat emissions which can indicate activity levels at industrial sites or power plants.
For investors, the value is twofold. First, satellites observe real-world physical outcomes that often correlate with financial performance. Second, satellites provide independence from company reporting and may reveal discrepancies or leading signals. You should think of satellite signals as an additional data layer to complement financials and market data.
Key Data Sources and Their Characteristics
Not all satellite data is the same. Select sensors and providers based on the spatial resolution you need, how often you need images, and your budget. Here are common options you will encounter.
- Public satellites, such as Landsat and Sentinel, provide free imagery. Sentinel-2 offers 10 meter resolution in visible and NIR bands with typically 5 to 10 day revisit when you combine satellites. Landsat is 30 meter resolution and useful for long-term time series.
- Commercial providers, like Planet Labs, Maxar, and BlackSky, offer higher resolution and higher revisit rates. Planet delivers daily coverage at 3 to 5 meter resolution. Maxar can provide sub-meter imagery for detailed object detection but at higher cost.
- SAR providers, including ICEYE and Capella, offer radar images that work in cloudy conditions and at night. These are useful for ports, oil storage, and ship monitoring.
- Ancillary signals like AIS for ship tracking, ADS-B for aircraft, or public IoT feeds can be fused with imagery to track logistics movements in near real time.
Tradeoff matrix
Higher spatial resolution usually means higher cost and smaller coverage areas. Higher revisit frequency allows better temporal analysis but may come at lower spatial resolution. You must match the sensor characteristics to the hypothesis you want to test.
Analytical Workflow: From Hypothesis to Signal
Work with satellite data like any rigorous signal development process. A structured workflow prevents chasing spurious correlations and helps you quantify edge and risk.
- Define hypothesis: be explicit about the economic linkage, for example more cars in parking lots at $WMT implies higher in-store sales and stronger short-term revenue.
- Choose data: select sensors, dates, and ancillary feeds that capture the causal mechanism. Consider cloud cover and revisit needs.
- Preprocess: orthorectify imagery, correct for atmospheric effects, mask clouds, and align geolocation to a common coordinate system.
- Feature engineering: extract measurable features such as vehicle counts, roof area reflectance, volumetric storage estimates, NDVI time series, or temperature anomalies.
- Model building: use statistical models or machine learning for regression, classification, or anomaly detection. Keep models parsimonious to avoid overfitting.
- Validation and backtest: validate signals against ground truth like store sales, government inventory reports, or company disclosures, and backtest over economically relevant periods.
- Operationalize: automate ingestion, monitoring, and alerting while respecting data licensing and latency constraints.
Practical preprocessing tips
Cloud masking is critical for optical data because clouds obscure features. For time series, use compositing or gap-filling techniques. When counting cars in parking lots you will need to normalize for time of day and day of week to avoid biased signals. For commodity stockpiles, calibrate shadow-based height estimation with on-site measurements when possible.
Machine Learning and Signal Extraction Techniques
Common ML approaches include convolutional neural networks for object detection, semantic segmentation for area estimates, and time-series models for trend detection. You will often combine deep learning with classical computer vision methods.
Examples of model tasks include:
- Object detection to count vehicles or ships using models like Faster R-CNN or YOLO families fine-tuned on labeled imagery.
- Semantic segmentation to map crop areas and compute NDVI averages across a field for yield forecasting.
- Change detection to spot construction, stockpile movement, or sudden drops in activity using image differencing or temporal convolutional networks.
Model selection depends on label availability, compute budget, and the need for interpretability. Simpler methods often generalize better across geographies and seasons, so don't default to complex models without testing.
Real-World Examples: Turning Pixels into Insights
Below are concise, realistic scenarios showing how investors can convert satellite signals into measurable signals you can test and backtest.
Example 1: Retail foot traffic using parking lot counts
Hypothesis: Weekly parking lot vehicle counts at $MCD and $WMT correlate with same-store sales. Method: Use 3 meter Planet imagery taken at weekly noon snapshots. Preprocess images and apply an object detection model to count vehicles. Normalize counts to weekdays.
Result scenario: Over a 12-month backtest, a normalized parking index explains 65 percent of weekly variation in same-store sales for a subset of stores. You validate with company weekly sales releases and find a two-week lead on reported same-store sales trends.
Example 2: Oil inventories via tank shadow analysis
Hypothesis: Visible roof shadow length and SAR-reflectivity at storage terminals can estimate stored volume at Cushing, Oklahoma. Method: Use high-resolution optical and SAR fusion. Derive surface area and infer height changes by shadow analysis when possible.
Result scenario: Estimated weekly inventory changes correlate with official API reports with a mean absolute error of 3 percent. The satellite-derived series provides independent cross-validation and sometimes flags unexpected draws that precede price moves in oil futures.
Example 3: Crop yields with NDVI time series
Hypothesis: NDVI trajectories for corn belts predict USDA yield revisions. Method: Use Sentinel-2 10 meter bands to compute NDVI and aggregate by county. Fit a seasonal model to map NDVI anomalies to yield deviations.
Result scenario: NDVI anomalies in key growing windows explain 40 to 50 percent of final yield variation, offering a quantitative input for commodity exposure management well before harvest reports.
Example 4: Port throughput and ship counts
Hypothesis: Container ship queue length outside a port predicts near-term throughput and logistics stress for importers like $AMZN suppliers. Method: Combine SAR to detect ships and AIS to identify type. Compute queue metrics and correlate with customs throughput data.
Result scenario: A rising queue index precedes reported throughput slowdowns and cost increases. This signal helps risk-manage inventory timing for companies reliant on imported goods.
Common Mistakes to Avoid
- Overfitting to visual patterns, then failing out of sample. How to avoid: Use rigorous cross-validation and holdout periods across different seasons and geographies.
- Ignoring geolocation and time-of-day bias. How to avoid: Align imagery to precise coordinates, normalize for snapshot times, and control for cyclical patterns like weekends and holidays.
- Misreading causation from correlation. How to avoid: Build and test explicit economic linkages and seek ground truth validation when possible.
- Underestimating latency and coverage limits. How to avoid: Factor in revisit frequency, cloud risk, and ingestion delays when designing signals for trading time horizons.
- Violating licensing or privacy rules. How to avoid: Verify commercial use rights, respect data licenses, and avoid aggregating personally identifiable information.
FAQ
Q: How accurate are vehicle counts from satellite imagery?
A: Accuracy depends on resolution, angle, and labeling quality. With sub-meter to 3 meter imagery and a well-trained detector you can often achieve 80 to 95 percent precision for parked vehicle counts at daytime snapshots. Cloud cover, occlusion, and shadows lower accuracy, so validate against ground truth samples.
Q: Can satellite data beat public reports for commodity inventories?
A: Satellite-derived estimates can provide independent, sometimes earlier, signals but they are rarely perfect substitutes. For commodities like oil or grain, satellites can detect relative draws and fills with useful accuracy, but you should treat them as complementary and validate against agency reports.
Q: What are the main legal or ethical constraints?
A: Commercial licensing governs how you can store, share, or resell imagery. Privacy concerns arise if you attempt to identify individuals. Make sure your use complies with provider licenses and applicable privacy laws in jurisdictions where the imagery is captured.
Q: How do you integrate satellite signals into a quantitative process?
A: Treat satellite signals like any alternative data: convert them into normalized, backtested factors that feed into risk models or alpha engines. Use feature selection, regularization, and economic filters to avoid overfitting. Operationalize monitoring and retraining to maintain signal quality.
Bottom Line
Satellite and geospatial data offer investors a growing set of independent, real-world signals that can improve situational awareness and potentially provide a leading edge. You can measure retail foot traffic, track inventories, estimate crop yields, and monitor logistics bottlenecks with the right sensors, models, and validation processes.
Start by defining a clear economic hypothesis, choose sensors that match your resolution and revisit needs, and validate thoroughly against ground truth. Be mindful of practical limits like cloud cover, latency, licensing, and model robustness. If you do this carefully, satellite insights can become a reliable part of your analysis toolkit.
Next steps: pick one pilot use case, secure a manageable data source such as Planet or Sentinel, build a simple detection pipeline, and validate the signal against a known data series. You will learn quickly what works and how satellite data can fit into your broader portfolio management process at the end of the day.


