
- Learn the parts of a candlestick (open, high, low, close) and what they represent about buying and selling pressure.
- Recognize key single-candle signals: doji, hammer, shooting star, and spinning top, and what they suggest about sentiment.
- Use multi-candle patterns like bullish/bearish engulfing and morning/evening stars to spot potential reversals or continuations.
- Always interpret patterns in context: trend direction, support/resistance, and volume improve reliability.
- Avoid common mistakes: over-relying on single candles, ignoring timeframes, and skipping confirmation.
Introduction
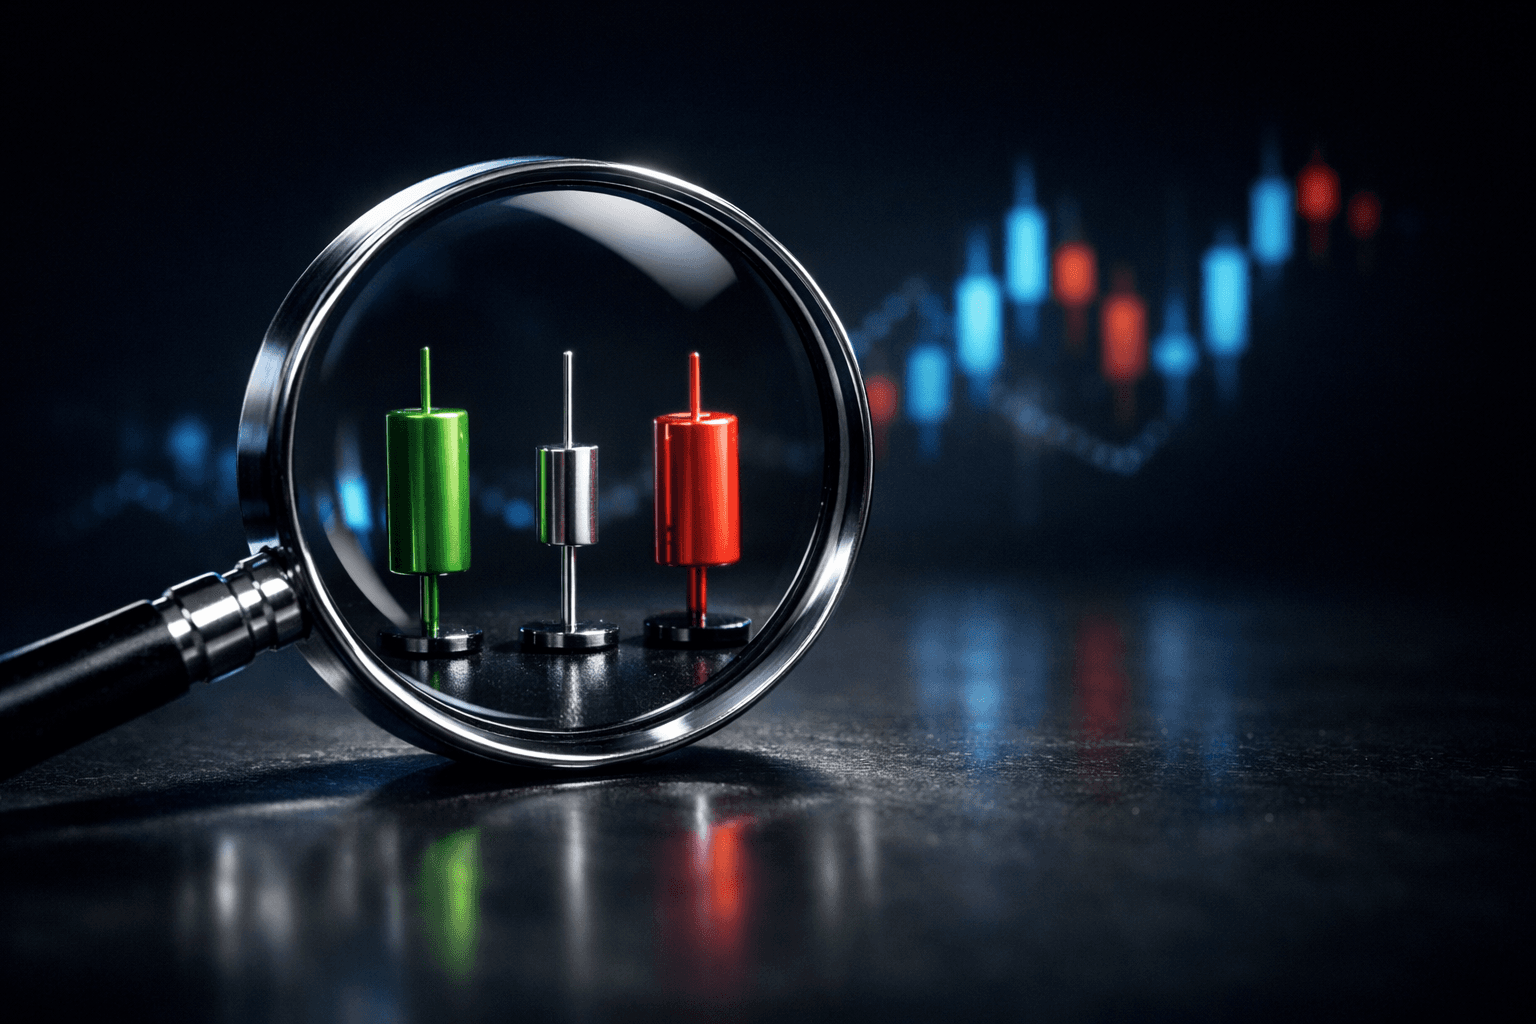
A candlestick chart is a visual tool that shows price movement for a security over a given time period using a simple rectangle (the body) and thin lines (wicks or shadows). Candlesticks package four pieces of data, open, high, low, and close, into one easy-to-read shape that reflects the tug-of-war between buyers and sellers.
For investors, learning to read candlesticks matters because these shapes reveal short-term shifts in market sentiment that precede larger moves. While not a crystal ball, candlestick patterns provide quick, visual clues about whether buyers or sellers held the edge during a period.
This guide teaches you what individual candlesticks mean, how common patterns indicate sentiment, and how to use context and confirmation to turn patterns into actionable observations. Examples use real tickers like $AAPL, $MSFT, $NVDA, and $TSLA to make concepts concrete.
What is a Candlestick and How to Read One
A candlestick represents price action for a chosen timeframe: a day, an hour, or a minute. Each candlestick shows the opening price, highest price, lowest price, and closing price for that period.
The main parts are the body and the wicks (also called shadows). The body spans the open and close. A long body means strong buying or selling pressure; a short body implies indecision. Wicks show rejection of higher or lower prices during the period.
Bullish vs Bearish Candles
A bullish candle closes above its open, indicating buyers were stronger during that period. A bearish candle closes below its open, indicating sellers dominated. On many charts a bullish candle is colored green or white and a bearish candle red or black, but the color is not important, focus on open vs close.
Example: $AAPL Daily Candle
Imagine $AAPL opens at $150, reaches a high of $155, drops to a low of $148, and closes at $153. The candle body (151 to 153) shows buyers pushed the price above the open. A long upper wick (to $155) means sellers stepped in at higher levels during the day.
Key Single-Candle Patterns: What Each One Means
Single-candle patterns are fast to spot and useful for noticing immediate sentiment shifts. They are easiest to interpret when they appear after a clear trend.
Doji
A doji forms when open and close are virtually equal, producing a cross or plus sign shape. It signals indecision: buyers pushed price up and sellers pushed it down, leaving no clear winner.
Interpretation: In an uptrend a doji can warn of weakening buying momentum. In a downtrend it can hint that selling pressure is easing. Confirmation from the next candle is important before acting on a doji.
Hammer and Hanging Man
Both have small bodies and long lower wicks. When they appear at the bottom of a downtrend they are called hammers and suggest possible bullish reversal as buyers rejected lower prices. When they appear at the top of an uptrend they are called hanging man and may indicate a bearish reversal.
Example numbers: In a downtrend where $TSLA falls from $200 to $150, a hammer that opens at $152, drops to $140, then closes at $151 shows buyers pushed price back near the open, a potential sign the selling may be exhausted.
Shooting Star
A shooting star has a small body and long upper wick and appears after an advance. It shows buyers tried to keep pushing higher but sellers drove the price back down, signaling potential short-term bearishness.
Interpretation: A shooting star at a resistance level, combined with falling volume, is a stronger warning of a pullback than a shooting star alone.
Spinning Top
A spinning top has a small body and short wicks. It indicates indecision and balance between buyers and sellers. Alone it is neutral; its value comes from where it appears and what follows.
Multi-Candle Patterns: Reversals and Continuations
Two- and three-candle patterns often offer clearer signals because they show a sequence of buyer-seller behavior. These patterns are widely used to identify reversals or continuations in price action.
Bullish and Bearish Engulfing
A bullish engulfing pattern occurs when a small bearish candle is followed by a larger bullish candle that completely engulfs the previous candle's body. This suggests buyers overwhelmed sellers and can signal a reversal higher when found after a downtrend.
Conversely, a bearish engulfing pattern appears after an uptrend: a small bullish candle followed by a large bearish candle that engulfs it, indicating sellers stepped in with strength.
Example: $MSFT is down for three days; Day 3 is a small red candle. Day 4 opens lower but rallies strongly to close above Day 3’s open, creating a bullish engulfing. Traders look for confirmation on Day 5 such as a higher close or increased volume before trusting the reversal.
Morning Star and Evening Star
A morning star is a three-candle bullish reversal: a large bearish candle, a small indecision candle (like a doji), then a large bullish candle that closes well into the first candle’s body. An evening star is the opposite and signals bearish reversal.
These patterns indicate a shift in control over multiple sessions, adding weight versus single-candle signals.
Tweezer Tops and Bottoms
Tweezer tops/bottoms are two candles with matching highs (tops) or lows (bottoms). They suggest rejection of a price level. A tweezer top after an uptrend can mark a resistance rejection; a tweezer bottom after a downtrend can mark support.
Context, Confirmation, and Timeframes
Candlestick patterns are clues, not guarantees. Their reliability depends heavily on context: the trend they appear in, nearby support and resistance, and the volume that accompanies them.
Rules to apply:
- Check the trend: reversal patterns are more meaningful after a clear up or down trend.
- Look for support/resistance: patterns at key levels are stronger than patterns in the middle of a range.
- Seek confirmation: wait for the next candle to confirm direction (for example, a bullish close after a hammer).
- Use volume: increased volume on the confirming candle adds conviction to the pattern.
Timeframe matters. A hammer on a daily chart generally carries more weight than a hammer on a 5-minute chart because it represents more aggregated market activity. For longer-term investing, prioritize daily and weekly candles; for short-term trading, 5-minute and 15-minute candles are common.
Real-World Examples: Patterns with Numbers
Seeing patterns with concrete numbers makes interpretation easier. Below are two realistic scenarios using $AAPL and $NVDA price moves.
Example 1, Reversal with a Hammer on $AAPL
Context: $AAPL has declined from $170 to $150 over eight trading days. On Day 9, $AAPL opens at $151, dips to $145, then rallies to close at $150.50. The candle has a small body near the top and a long lower wick, a hammer.
Interpretation and next steps: Because the hammer appears after a downtrend and near prior support at $150, it suggests sellers were rejected at lower prices. Traders often wait for Day 10 to close above Day 9’s high (say above $152) for confirmation, and watch volume. If volume on Day 10 increases, the probability of a short-term bounce is higher.
Example 2, Bullish Engulfing on $NVDA
Context: $NVDA is in a short-term pullback from $300 to $260. Day 1 shows a small red candle closing at $265. Day 2 opens at $262 and rallies to close at $275, fully engulfing Day 1’s body.
Interpretation: The bullish engulfing suggests buyers re-entered aggressively. A practical check: confirm on Day 3 with a higher close and rising volume. If confirmed, this pattern indicates a higher probability that the pullback may be ending and a recovery could follow.
How to Practice and Build Confidence
Start by observing charts without trading. Pick a few stocks such as $MSFT, $AAPL, $NVDA, and $TSLA and scan daily charts for common patterns. Note the trend, the pattern, and what happens over the next 3, 5 candles.
Keep a simple log: date, ticker, pattern, context (trend/support), confirmation (yes/no), and outcome (price change over next 5 days). Over time you will learn which patterns and settings work best for your time horizon and risk tolerance.
Common Mistakes to Avoid
- Relying on a single candle without confirmation, wait for a follow-up candle or supporting indicators before concluding a reversal.
- Ignoring trend and context, a hammer in the middle of a strong uptrend is less significant than a hammer at a downtrend bottom.
- Using patterns on inappropriate timeframes, day traders should use intraday candles; long-term investors should focus on daily or weekly candles.
- Neglecting volume, patterns with low volume are less reliable than those accompanied by increased trading volume.
- Overfitting historical examples, past patterns do not guarantee future results; backtest methodically before trusting a strategy.
FAQ
Q: How reliable are candlestick patterns?
A: Candlestick patterns provide useful insights but are not infallible. Their reliability improves when combined with trend analysis, support/resistance, volume, and confirmation candles. Many traders treat them as one tool in a broader toolkit rather than a standalone signal.
Q: Which timeframe should I use to read candlesticks?
A: Choose a timeframe that matches your trading horizon. Day traders often use 1, 15 minute candles; swing traders look at hourly and daily candles; long-term investors study daily and weekly candles. Longer timeframes generally yield stronger signals because they aggregate more market action.
Q: Can I use indicators with candlestick patterns?
A: Yes. Popular combinations include moving averages (for trend), RSI or MACD (for momentum), and volume indicators. These help confirm patterns and filter out false signals. Use indicators sparingly to avoid conflicting signals.
Q: How do I test whether a pattern works for me?
A: Backtest by reviewing historical charts and recording outcomes for a sample of patterns. Track entry/exit rules, timeframe, confirmation requirements, and performance over many trades to assess statistical edge before risking real capital.
Bottom Line
Candlestick patterns are a practical, visual way to read short-term buyer and seller psychology. Single candles like dojis and hammers give quick clues, while multi-candle patterns like engulfing candles and morning stars add conviction when they appear in the right context.
To use candlesticks effectively, study their anatomy, always consider trend and support/resistance, seek confirmation (especially via the next candle and volume), and practice on historical charts before applying signals in live situations. Treat candlesticks as signal flags, helpful guides that work best when combined with other confirmation tools and disciplined risk management.


