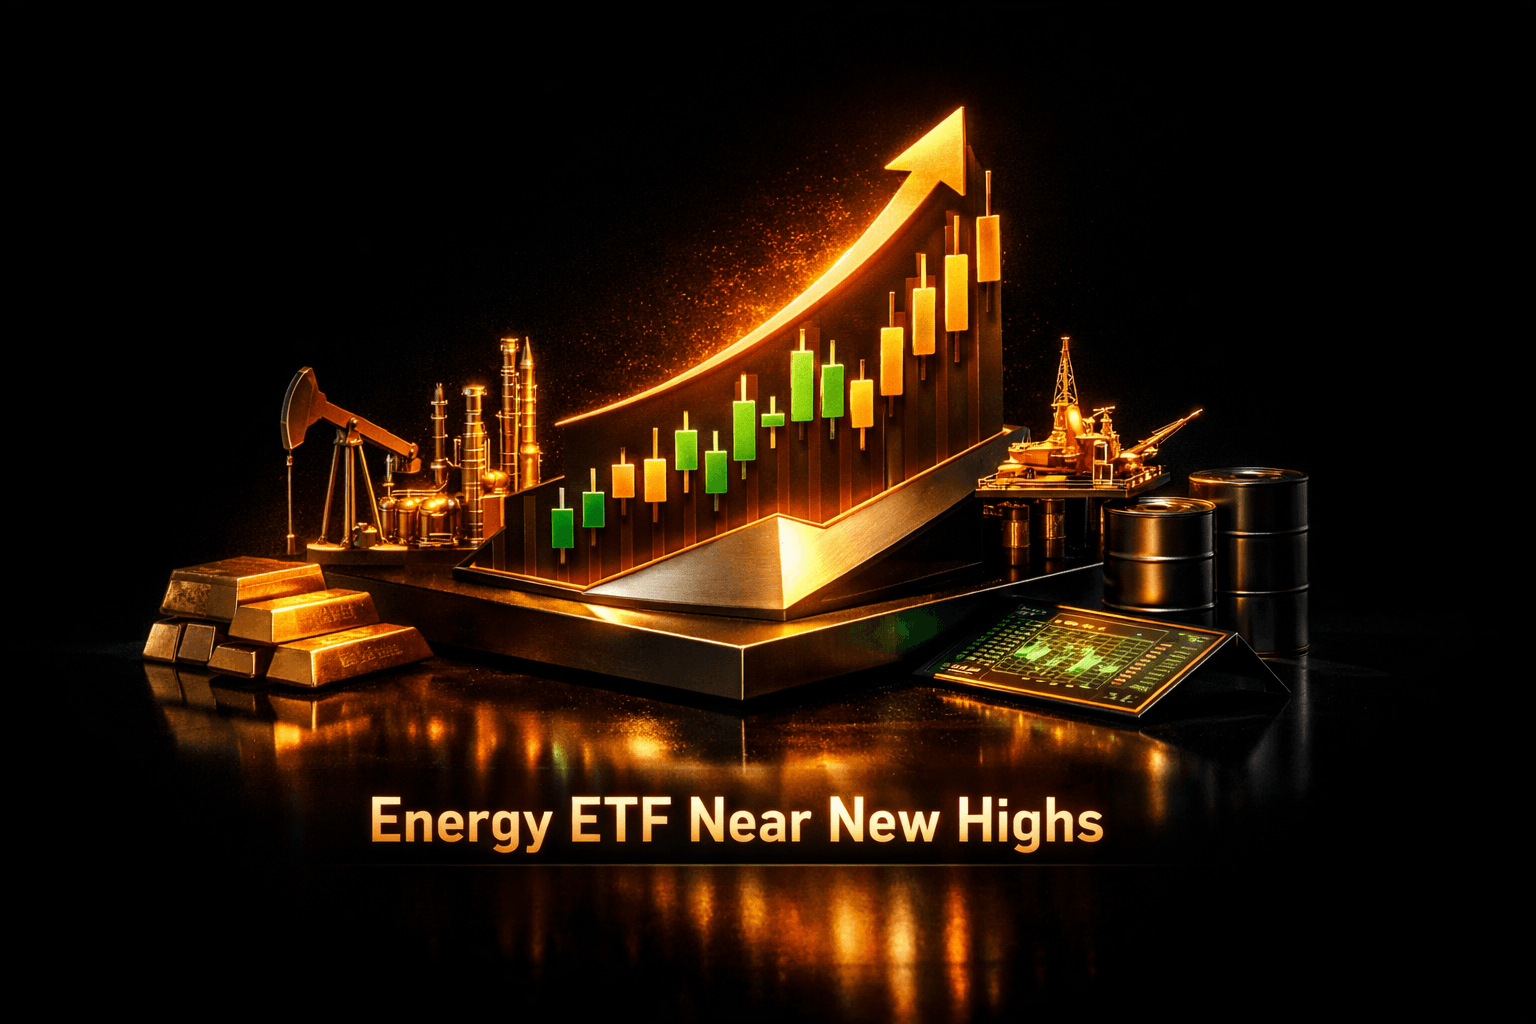
XLE Outlook: Energy ETF Near New Highs on Oil Shock
Geopolitical events in the Middle East have driven crude above $100 and lifted $XLE to fresh highs, producing strong YTD returns. This report breaks down the drivers, valuation context, technicals, and key risks for retail investors.
Executive Summary
Investment Thesis: $XLE, the SPDR Energy Select Sector ETF, is benefiting from a powerful oil price shock tied to the Iran conflict and related geopolitical headlines. The ETF trades near its 52-week high after a strong multi-quarter run, delivering a YTD return over 40% and concentrated exposure to large integrated and exploration & production names. The near-term outlook is tilted bullish while crude remains elevated, though volatility and concentration risk mean you should expect sharp pullbacks.
Current Price: $62.96 | Key Metric: YTD Return 40.83% | Stance: BULLISH
Company Overview
$XLE is the SPDR Energy Select Sector ETF, designed to provide exposure to the energy sector of the S&P 500. It tracks companies primarily involved in oil, gas, and consumable fuels as well as energy equipment and services.
Key Products & Competitive Position
- Core Business: Sector ETF offering broad exposure to U.S. energy companies, dominated by large integrated oil & gas names and major service contractors.
- Key Products: Single ETF ticker $XLE that gives investors liquid, cost-efficient exposure to the S&P 500 energy sector.
- Competitive Moat: State Street's SPDR franchise, large AUM, tight spreads and strong secondary-market liquidity make $XLE the go-to ETF for many retail and institutional flows.
Recent Developments
In late March 2026, a dramatic geopolitical escalation tied to Iran pushed WTI crude above $100 per barrel and triggered a sector-wide rally. Headlines include threats targeting Iranian oil infrastructure and disruptions to shipping in the Strait of Hormuz. Those events are the primary catalyst behind recent inflows into $XLE and other energy ETFs.
Financial Snapshot
Revenue & Earnings Trends
$XLE itself does not generate operating revenue; its performance reflects the revenue and earnings of constituent companies. Over the past 12 months the S&P Energy sector has seen a meaningful recovery in cash flow and free cash flow, driven by higher commodity prices and the resumption of capex discipline. That backdrop explains the ETF's strong YTD and 1-year returns, which are roughly 40.8% and 39.1% respectively.
Balance Sheet Highlights
As an ETF, $XLE's balance-sheet exposure is through constituent companies. Many large integrated names have rebuilt balance sheets since the prior cycle, reducing leverage and increasing buybacks and dividends. Still, smaller E&P and services firms carry more balance-sheet variability, which increases drawdown risk for the ETF when commodity prices fall.
Valuation Analysis
Current Valuation Metrics
Historical Comparison
On a NAV and price basis $XLE is trading well above its 52-week low and is at or near the recent 52-week high reached on 2026-03-27. The ETF's price action has outpaced its 2-year average close and standard deviation measures, reflecting higher oil prices and concentrated flows into energy. Historical multiples for energy companies expand and contract with oil; right now multiples are supported by strong commodity-driven cash flow.
Fair Value Estimate
Fair value for $XLE is best framed as a function of underlying commodity prices and the forward cash flow outlook for major constituents. A simple NAV sensitivity shows material upside while WTI remains north of $85 to $90 per barrel, and meaningful downside if crude returns to the $60s. Given the current oil shock, analysts model a range of fair values. Using a scenario approach, if crude averages $95 next 12 months, fair value for $XLE aligns with the current level to modest upside. If crude falls back to $70, fair value could reprice materially lower.
Competitive Landscape
Market Position
Market Share: Largest energy sector ETF by assets | Ranking: #1 broad U.S. energy sector ETF
Key Competitors
Competitive Advantages
- Moat 1: Liquidity and brand strength from the SPDR platform, resulting in tight spreads and easy execution.
- Moat 2: Concentrated exposure to large-cap energy names, which often lead sector moves when commodities rally.
- Moat 3: Cost effectiveness and widespread brokerage availability, which attracts both retail and institutional flows.
Earnings Track Record
Last 4 Quarters: 3 beats / 1 misses
Recent Earnings History
Guidance Trend
Management commentary from large constituents has emphasized capital discipline, shareholder returns and variable capex. Guidance tends to be conservative when oil is volatile, and revisions can be swift if commodity prices move materially. Analysts note that forward estimates remain sensitive to commodity assumptions.
Analyst Sentiment
Consensus Rating:
Price Targets
- Low: $50
- Mean: $64 (+1.7% upside)
- High: $78
Recent Analyst Actions
Recent coverage emphasizes tactical exposure to energy for commodity-driven portfolios. A number of strategists increased energy weightings after the March crude move, while some caution that any de-escalation in the Middle East would pressure the group quickly. Analysts are updating models to reflect higher near-term commodity prices and their impact on cash flow and dividends across the sector.
Recent News & Catalysts
Key Developments
- Iran conflict supply shock: Reports and commentary indicate the Iran conflict may be the largest oil supply shock in history, sending crude roughly 39% higher and boosting $XLE.
- Crude above $100: Headlines in late March show WTI moving past $100 amid threats targeting Iran's oil infrastructure and constrained shipping routes.
- Sector leadership shifts: Tactical rotation into energy has outpaced other sectors, producing strong ETF inflows and widening performance dispersion.
Upcoming Catalysts
Next Earnings: Major constituents report staggered through April and May 2026 | Key Events: OPEC+ announcements, weekly U.S. crude inventory reports, any geopolitical developments in the Middle East
Technical Outlook
Current Price: $62.96 vs 52-Week High: $62.79 (+0.27% from high)
Trend Analysis
$XLE has been in a strong uptrend, driven by commodity momentum and sector rotation. The ETF recently tested and slightly exceeded its 52-week high, signalling broad participation in the move. Momentum indicators are stretched, so mean reversion on short-term timeframes is possible, while the intermediate trend remains bullish as long as oil prices hold elevated levels.
Key Levels
- Resistance: $68, $75
- Support: $60, $54
Bull vs Bear Case
Bull Case
- Catalyst 1: Continued geopolitical disruption keeps WTI elevated above $90 to $100, which flows through to higher revenues and cash flow for constituents.
- Catalyst 2: Capital discipline at major oil companies supports dividends and buybacks, attracting yield-seeking flows into $XLE.
- Catalyst 3: Relative undervaluation versus commodity upside, combined with concentrated large-cap exposure, means gains can compound quickly during rallies.
Bull Target: $75 (+19%)
Bear Case
- Risk 1: Rapid de-escalation or a diplomatic resolution could send oil sharply lower, triggering a sectorwide selloff.
- Risk 2: High concentration in a few large names means idiosyncratic weakness at majors could disproportionately impact $XLE.
- Risk 3: Elevated valuation on forward cashflow assumptions is vulnerable to commodity mean reversion, producing outsized downside.
Bear Target: $45 (-28%)
Risks to Consider
- Valuation Risk: $XLE's current level prices in sustained high commodity prices; if oil reverses lower, re-rating risk is significant.
- Concentration Risk: The ETF is top-heavy in large integrated names, which can amplify exposure to firm-specific news and corporate actions.
- Macro Risk: Global demand shocks, recession risk or a strong U.S. dollar could weaken crude and pressure energy equities.
- Execution Risk: For those trading the ETF, rapid intraday volatility may widen spreads and increase slippage during news-driven moves.
Bottom Line
Investment Verdict: BULLISH
$XLE offers concentrated, liquid exposure to the U.S. energy sector and is currently benefiting from a major commodity-driven rally. Momentum and fundamentals look constructive while crude stays elevated, but the ETF carries higher event risk and concentration that can produce quick reversals.
Action Items for Investors
- Long-term investors: Consider whether current energy weightings match your target allocation, and use any material pullbacks to assess rebalancing rather than chasing immediate strength.
- Short-term traders: Watch crude price action, OPEC+ headlines and weekly inventory prints. Use disciplined stops and be prepared for sharp intraday moves.
- Risk management: Size positions to account for sector volatility, diversify across asset classes and set clear exit rules if oil trends reverse.
What to Watch This Week
- Weekly U.S. crude inventory reports and API numbers.
- Any OPEC+ statements or meetings that could influence supply expectations.
- Geopolitical updates from the Middle East, especially any developments affecting shipping routes or Iranian oil production.
Sources
Share this report
Share this article
Spread the word on social media
Think XLE will outperform? Prove it.
Free practice contests — earn Alpha CoinsExplore More Content
Disclaimer: StockAlpha.ai content is for informational and educational purposes only. It is not personalized investment advice. Sentiment ratings and market analysis reflect data-driven observations, not buy, sell, or hold recommendations. Always consult a qualified financial advisor before making investment decisions. Past performance does not guarantee future results.