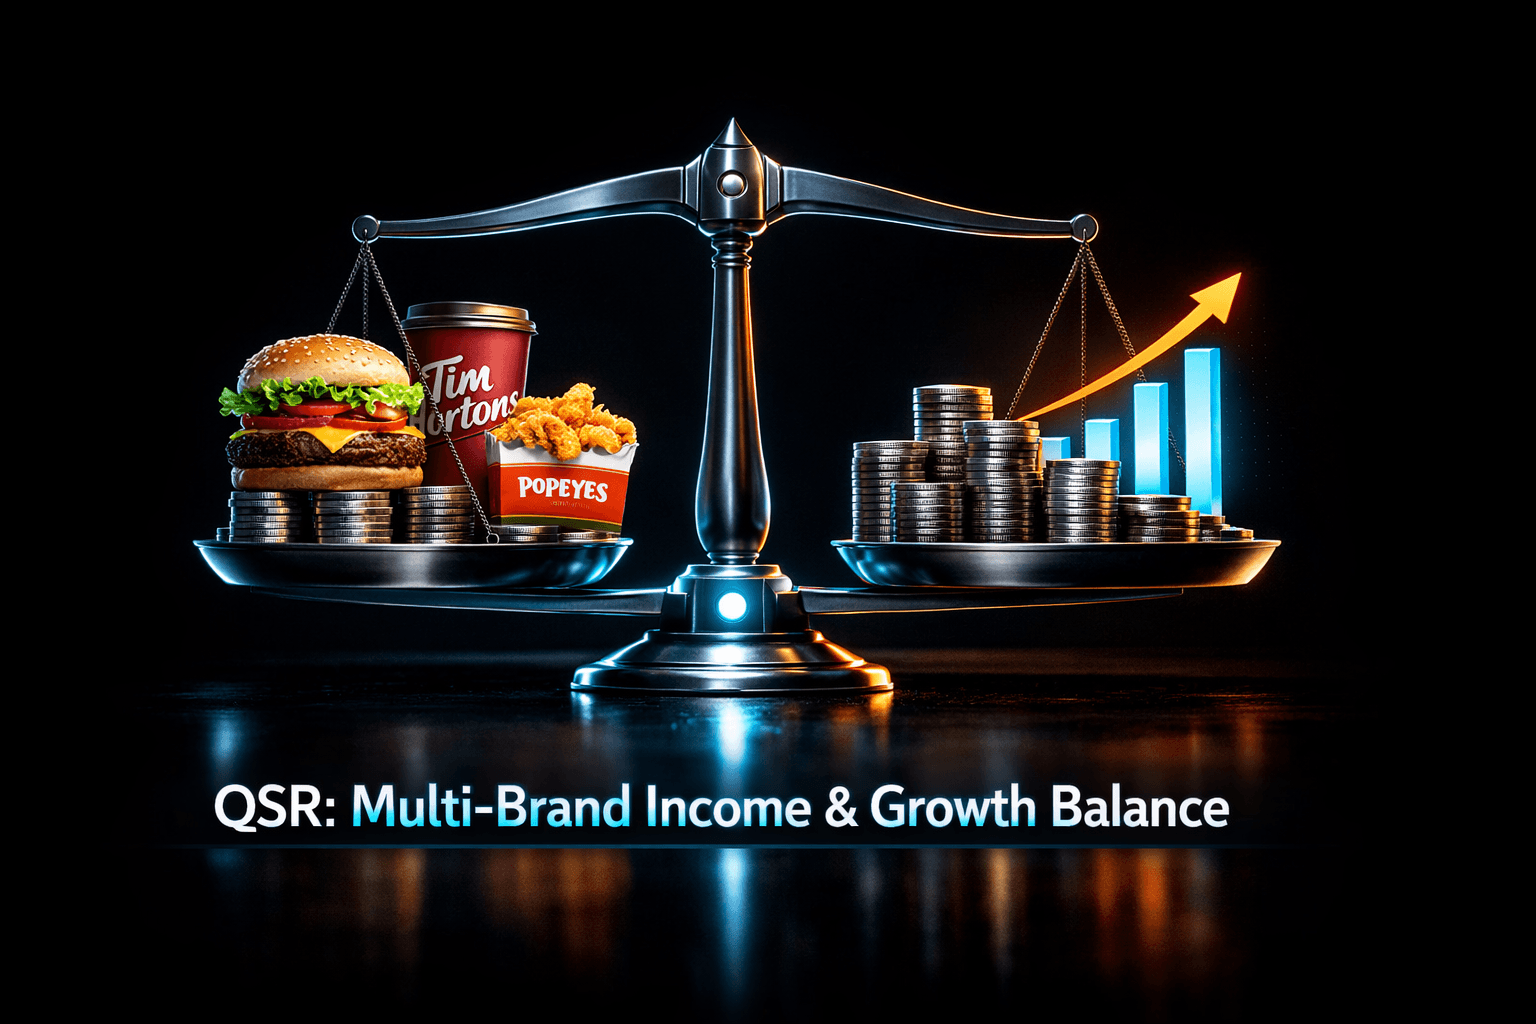
QSR: Burger King Strength, Popeyes Drag
Restaurant Brands International (QSR) posts consecutive EPS beats and offers a 3.6% yield, but Popeyes' soft comps and elevated leverage temper upside. Analysts remain constructive, yet mixed fundamentals keep the outlook balanced.
Executive Summary
Investment Thesis: Restaurant Brands International ($QSR) benefits from a differentiated multi-brand model led by Burger King and Tim Hortons that continues to generate steady cash flow, a healthy dividend and share-buyback optionality. Recent quarters show consistent EPS beats and modest system-wide sales growth, but Popeyes' comp softness and a high leverage profile are material counterweights. Analysts price in roughly 17.6% implied upside to the mean target, leaving room for upside if Popeyes stabilizes or downside if margin pressures persist.
Current Price: $72.41 as of Friday, October 30 | Key Metric: P/E 16.76 | Stance: NEUTRAL
Company Overview
Restaurant Brands International Inc. ($QSR) is a global quick-service restaurant company that owns and franchises Burger King, Tim Hortons and Popeyes. The company operates a mostly franchised model that generates royalties and franchise fees, plus company-owned restaurant income in select markets.
Key Products & Competitive Position
- Core Business: Multi-brand franchisor with a focus on global expansion, digital ordering and value-based menu initiatives.
- Key Products: Quick-service burger offerings (Burger King), coffee and breakfast (Tim Hortons), and fried chicken (Popeyes).
- Competitive Moat: Global brand recognition across multiple concepts, a largely asset-light franchised model that scales earnings, and established franchisee networks for rapid system growth.
Recent Developments
QSR reported Q3 2026 results on October 29, showing a small EPS beat and 3.8% comparable sales growth driven primarily by Burger King. System-wide sales grew about 6.2% and net restaurant growth was ~3%. Media coverage highlights Burger King strength while flagging ongoing comp pressure at Popeyes, particularly around menu complexity for chicken wings and limited assortment choices.
Financial Snapshot
Revenue & Earnings Trends
Revenue for the last twelve months sits near $9.8B, reflecting low-single-digit top-line growth year over year. QSR has delivered four consecutive small EPS beats through Q3 2026, with EPS in Q3 at $1.10 versus estimates of $1.08. Earnings growth has been stronger than revenue growth, aided by operating leverage in franchise revenues and share repurchases.
Balance Sheet Highlights
Total debt is elevated, roughly $15.46B, against cash of about $974M. That generates a net-debt heavy profile and a debt-to-equity ratio over 200% per public data. Liquidity ratios are below 1.0, with a current ratio of 0.96 and quick ratio near 0.73 in some data sources, so short-term liquidity depends on operating cash flow. Operating cash flow and free cash flow have been positive, supporting dividends and buybacks but leaving limited cushion for protracted shocks without financing actions.
Valuation Analysis
Current Valuation Metrics
Historical Comparison
QSR's current trailing P/E of 16.8 is slightly below a rough 5-year median multiple in the high teens, reflecting slower top-line growth but steady cash generation. EV/EBITDA near 12x sits around the mid-point of historical trading ranges for the company, while the 3.6% dividend yield is above many large-cap restaurant peers and supports the total return profile.
Fair Value Estimate
Using a multiples-based approach and a conservative DCF overlay that assumes mid-single-digit revenue growth and gradual margin recovery at Popeyes, a fair-value range centers roughly in the low-to-mid $80s per share, with an illustrative midpoint near $82. That aligns broadly with analyst mean targets near $85, but the range is sensitive to Popeyes' recovery timeline and the cost of servicing current debt.
Competitive Landscape
Market Position
Market Share: Significant U.S. and international franchise presence across three major quick-service concepts | Ranking: Top 3 global quick-service operator by system units for its brands combined
Key Competitors
Competitive Advantages
- Moat 1: Brand scale across multiple concepts that diversifies revenue drivers and lowers single-brand risk.
- Moat 2: Mostly franchised model, which converts unit growth into high-margin royalty revenue with limited capital intensity.
- Moat 3: Global franchisee networks and digital/order capabilities that support system sales growth and margin capture.
Earnings Track Record
Last 4 Quarters: 4 beats / 0 misses
Recent Earnings History
Guidance Trend
Management has emphasized steady system growth and unit development while noting brand-specific headwinds at Popeyes. Guidance has been described qualitatively on earnings calls as cautious but constructive, with a focus on margin management and franchise support. Analysts appear to model gradual recovery rather than immediate re-acceleration for underperforming units.
Analyst Sentiment
Consensus Rating:
Price Targets
- Low: $80
- Mean: $85.18 (+17.6% upside)
- High: $92
Recent Analyst Actions
Following Q3 results, several sell-side analysts reiterated constructive ratings and updated models to reflect Burger King momentum and a slower Popeyes recovery. The consensus still skews positive, but the dispersion between high and low targets indicates differing assumptions about Popeyes' timeline to normalized comps and margin contribution.
Recent News & Catalysts
Key Developments
- Burger King strength: Q3 comparable sales growth and system-wide gains have been highlighted by multiple outlets as the primary earnings driver (MarketBeat, 10/31/2026).
- Popeyes operational headwinds: Coverage points to menu complexity around chicken wings and limited options contributing to mixed comps at Popeyes (New York Post, 10/30/2026).
- Analyst commentary: Mixed sentiment pieces frame QSR as fairly valued while noting pockets of upside if Popeyes stabilizes (Seeking Alpha, 10/29 and 10/31/2026).
Upcoming Catalysts
Next Earnings: Next quarterly report expected in early 2027 (company calendar to confirm) | Key Events: Popeyes comp trajectory updates, unit development cadence, and commentary on capital allocation and leverage reduction plans
Technical Outlook
Current Price: $72.41 as of Friday, October 30 vs 52-Week High: $81.96 (-11.6% from high)
Trend Analysis
Price action shows consolidation after earlier strength, reflecting the market balancing brand-level divergence. The stock has traded in a range between roughly $64.50 and $82 over the past year, with recent trading reflecting cautious positioning ahead of operational updates from Popeyes.
Key Levels
- Resistance: $78, $82
- Support: $71, $65
Bull vs Bear Case
Bull Case
- Catalyst 1: Continued Burger King momentum that lifts system-wide sales and operating leverage.
- Catalyst 2: Popeyes stabilization and menu simplification that restores comp trends and margin contribution.
- Catalyst 3: Shareholder returns funded by cash flow and selective buybacks, plus a sustainable 3.5% yield that supports total return.
Bull Target: $92 (+27%)
Bear Case
- Risk 1: Prolonged weakness at Popeyes that drags system growth and forces incremental marketing or promotional spend.
- Risk 2: High leverage that limits flexibility to absorb margin shocks or pursue opportunistic investments.
- Risk 3: Competitive pressure from larger rivals and cost inflation that compresses franchisee economics and slows unit growth.
Bear Target: $64.52 (-10.8%)
Risks to Consider
- Valuation Risk: Multiples assume recovery for Popeyes; failure to meet those expectations could compress valuation quickly.
- Competitive Risk: Intense pricing and menu innovation from larger players could erode share or force margin-dilutive promotions.
- Macro Risk: Consumer spending weakness or higher commodity and labor costs could hit same-store sales and franchisee profitability.
- Execution Risk: Operational missteps at any major brand, particularly Popeyes, could slow system growth and pressure margins.
Bottom Line
Investment Verdict: NEUTRAL
QSR exhibits a mixed but stable profile: dependable cash flow, a meaningful dividend, and consecutive earnings beats point to operational resilience, yet brand-level divergence and a leveraged balance sheet limit conviction. Analysts remain broadly constructive, but the path to the consensus mean target depends primarily on Popeyes' recovery and manageable leverage dynamics. How quickly can Popeyes rebalance menu complexity and restore comps? And will Burger King momentum be sufficient to offset any lingering weakness?
Action Items for Investors
- Long-term investors: Track management commentary on Popeyes recovery, debt reduction targets and buyback cadence before shifting long-term allocations.
- Short-term traders: Watch QSR around the $71 support level and intraday reactions to news; consider volatility around brand-specific headlines.
- Risk management: Monitor leverage metrics and free cash flow trends, and set size limits or hedges consistent with portfolio risk tolerances.
What to Watch This Week
- Popeyes' operational updates and management commentary in post-earnings materials.
- Analyst note revisions following the Q3 release that may adjust forward estimates and targets.
- Macro indicators on consumer spending and commodity price movements that affect restaurant margins.
Sources
Share this report
Share this article
Spread the word on social media
Think QSR will outperform? Prove it.
Free practice contests — earn Alpha CoinsExplore More Content
Disclaimer: StockAlpha.ai content is for informational and educational purposes only. It is not personalized investment advice. Sentiment ratings and market analysis reflect data-driven observations, not buy, sell, or hold recommendations. Always consult a qualified financial advisor before making investment decisions. Past performance does not guarantee future results.
Spotted something wrong? Report an error.