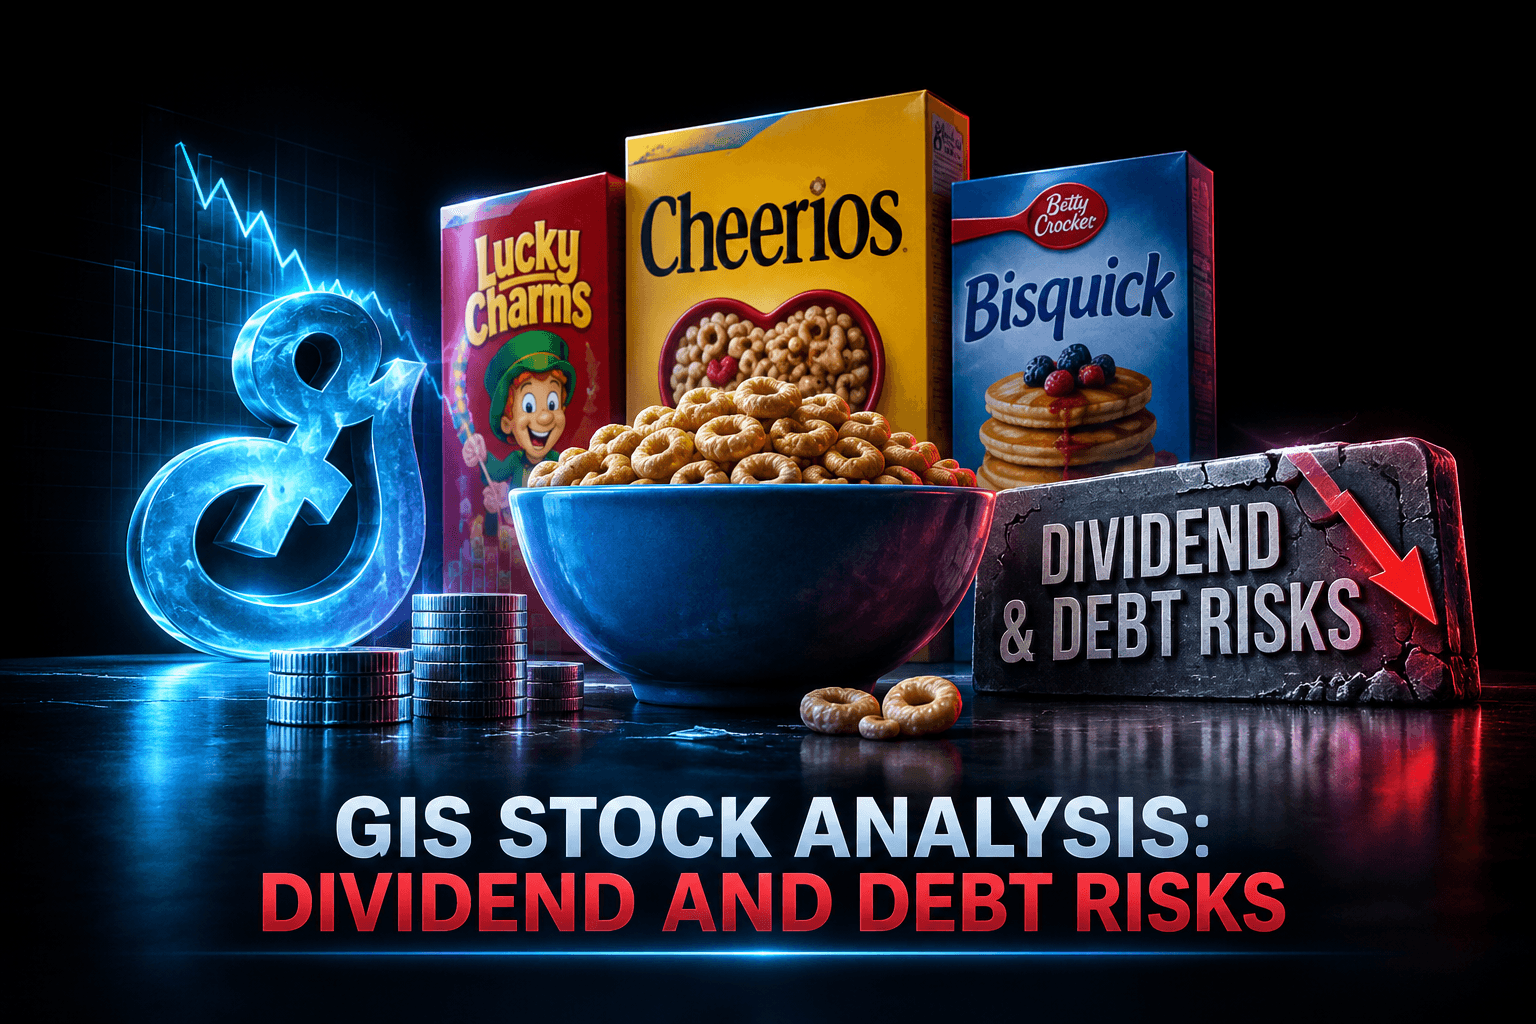
GIS Stock Analysis: Dividend and Debt Risks
General Mills closed Friday at $34.32, near the lower end of its 52-week range, with a 7.11% indicated dividend yield and a recent quarterly earnings beat. Falling revenue, negative trailing EPS, substantial debt and a reported warning about a possible payout reduction remain important counterweights.
Executive Summary
Investment Thesis: General Mills combines durable household food brands and meaningful cash generation with weakening recent financial results. Revenue and earnings are under pressure, while debt and a potential dividend reduction are material concerns for shareholders focused on income. A recent quarterly EPS beat and a new operating model could help execution, but their effect on sustained growth has not yet been demonstrated. The balance of these signals supports a bearish market sentiment assessment, not an investment recommendation.
Current Price: $34.32 as of Friday, November 13 | Key Metric: TTM EPS of -$1.67 and dividend yield of 7.11% | Stance: BEARISH
U.S. markets were closed Saturday, November 14; the next regular trading session is Monday, November 16. GIS rose $0.80, or 2.39%, on Friday from its $33.52 previous close, but one session’s gain doesn’t erase the stock’s decline from its 52-week high or the company’s operating challenges.
Company Overview
General Mills, Inc. is a Minneapolis-based packaged-food company that sells branded food products in retail, foodservice and pet-food markets. Its portfolio spans familiar grocery staples and products for consumers and pets, giving it recurring demand and broad retail distribution. Brand recognition can support pricing and shelf access, but it doesn’t shield the company from changing consumer preferences, cost pressures or competition.
Key Products & Competitive Position
- Core Business: Packaged foods sold through grocery and other retail channels, alongside foodservice and pet-food operations.
- Key Products: Brands include Cheerios and other cereal products, Betty Crocker, Pillsbury and snack and baking products, as well as Blue Buffalo pet food.
- Competitive Moat: Established brands, retailer relationships, product scale and distribution create advantages that can be difficult for smaller challengers to reproduce. These advantages require continuing investment and don’t guarantee market-share gains.
Recent Developments
On November 10, General Mills announced a new operating model and senior leadership appointments, effective January 1, 2027. The company says the model is intended to sharpen strategic focus, improve commercial execution and support profitable growth through greater efficiency. Those are stated objectives, not reported results; investors can assess progress through margins, sales trends and subsequent management commentary. The announcement arrives as reported revenue and earnings growth are negative, making implementation and measurable follow-through important.
Financial Snapshot
These reported indicators deserve context. A negative P/E reflects negative trailing earnings, so it is not a conventional measure of cheapness. Data-provider figures can vary: the supplied snapshot lists TTM EPS of -$1.67 and ROE of -10.69%, while an additional source reports -$1.64 and -10.49%. The report uses the supplied snapshot for its headline metrics.
Revenue & Earnings Trends
Available data show revenue of approximately $18.30 billion and revenue growth of -2.8%. Earnings growth is reported at -66.7%, while net income to common shareholders is approximately -$894.8 million. The figures indicate that recent profitability has weakened substantially, although the provided information doesn’t break down the causes by product, geography or one-time items. Gross margin is reported at 33.73%, and investors will want to see whether sales stabilization and cost controls can protect that margin.
The latest supplied earnings result was EPS of $0.75 versus a $0.717 estimate, a beat of about 4.6%. That is a positive data point, but one quarterly beat doesn’t resolve the negative trailing EPS or declining growth metrics. The next listed report is expected December 23, 2026, with estimated EPS of $0.96.
Balance Sheet Highlights
Total debt is reported at approximately $13.62 billion against cash of about $433 million, implying net debt near $13.18 billion. Debt-to-equity is 182.42%, and total debt is roughly four times the reported $3.42 billion of EBITDA. These measures make debt reduction and cash-flow durability important considerations, especially if the company is also seeking funds for growth initiatives.
Liquidity measures are tight: the current ratio is 0.70 and the quick ratio is 0.32. Against those concerns, reported operating cash flow is approximately $2.07 billion and free cash flow about $1.30 billion. Cash generation provides capacity to service obligations, but the available figures alone don’t establish the dividend’s long-term safety or the pace at which leverage can decline.
Valuation Analysis
Current Valuation Metrics
Forward P/E is calculated from the $34.32 price and the additional-source forward EPS estimate of $3.15. It depends on earnings forecasts, which can change; the negative trailing EPS makes the historical P/E less useful for comparison. The P/S estimate uses $18.35 billion market capitalization divided by reported revenue of about $18.30 billion. Comparisons with industry averages are not included because consistent peer figures weren’t provided.
Historical Comparison
A comparable five-year valuation series was not provided, so a precise assessment against GIS’s five-year average would be speculative. The available two-year price data show an average close of $43.93 and a total return of -40.71%, while the stock closed at $34.32 on Friday. That history signals a meaningful deterioration in market performance, but it doesn’t by itself establish fair value or predict a reversal.
Fair Value Estimate
The supplied analyst-target set puts the mean at $35.10, median at $34.50 and range at $30 to $43. The mean is about 2.3% above Friday’s close, suggesting limited implied upside using that particular set. A separate Yahoo Finance extraction reports a mean target of $36.53 and a high target of $45, illustrating that analyst coverage and data snapshots differ. Neither target set is a guarantee; valuation depends on the path of earnings, cash generation, leverage and dividend policy.
Competitive Landscape
Market Position
Market Share: Not specified in the supplied data | Ranking: Major branded packaged-food company, precise industry rank unavailable
General Mills competes across categories that have different rivals and consumer dynamics, so a single market-share figure would be misleading without category-level data. Scale and brand familiarity matter in grocery, but private-label alternatives and promotional competition can constrain price increases. Comparisons also need to account for differences in product mix and exposure to pet food, snacks and foodservice.
Key Competitors
Competitive Advantages
- Brand Recognition: Familiar labels can support repeat purchases and access to retail shelf space, although consumer loyalty varies by category.
- Distribution Scale: A broad commercial footprint supports distribution to many retailers and foodservice customers.
- Portfolio Breadth: Exposure to multiple food categories can diversify demand, though weakness across several categories can still pressure total results.
Earnings Track Record
Last 4 Quarters: 1 documented beat / 0 documented misses
Only one recent actual-versus-estimate result was included in the supplied information. The other three quarters are unverified here, so the count above is not a complete four-quarter record and should not be interpreted as evidence of three beats or misses.
Recent Earnings History
Guidance Trend
No formal full-year guidance revisions were included in the supplied data. The September-quarter beat and management’s efficiency-focused operating model are constructive signs to track, but they don’t establish a change in the broader earnings trend. For the December 23 report, attention can center on sales volumes, pricing, margins, cash flow, leverage and any updated outlook. Investors should also distinguish reported EPS from underlying performance and review management’s explanation of any nonrecurring items.
Analyst Sentiment
Consensus Rating:
The provided count covers 20 analysts and is weighted toward Hold, with four Buy or Strong Buy ratings and four Sell or Strong Sell ratings. The additional Yahoo Finance extraction lists 17 analyst opinions, so coverage totals differ between sources. Consensus labels summarize third-party views, not a forecast certainty or a personalized assessment.
Price Targets
- Low: $30
- Mean: $35.10 (+2.3% implied upside)
- High: $43
Recent Analyst Actions
On November 12, Piper Sandler moved its rating from Overweight to Neutral and lowered its target from $41 to $35. A Barron’s report that day said Piper Sandler warned of a potential 35% dividend reduction as General Mills works to reduce debt and fund growth. That potential cut is an analyst scenario, not a company-announced decision. Earlier, Barclays maintained Equal-Weight and raised its target to $37 on September 25; RBC Capital maintained Outperform at $45 and TD Cowen maintained Hold while raising its target to $33 on September 24.
Recent News & Catalysts
Key Developments
- Dividend Risk Discussion: Barron’s reported Piper Sandler’s warning that a dividend reduction of as much as 35% could be possible as the company manages debt and growth investment. The company’s actual dividend policy and any formal change should be verified through company announcements.
- Operating Model Changes: General Mills announced a new operating model and leadership appointments on November 10, scheduled to take effect January 1, 2027. The expected benefits will depend on execution and whether efficiencies translate into improved results.
- Latest Earnings Beat: The September report showed EPS of $0.75 against a $0.717 estimate. The result exceeded consensus, but reported negative revenue and earnings growth remain relevant counterpoints.
Upcoming Catalysts
Next Earnings: December 23, 2026, expected; EPS estimate $0.96 | Key Events: Operating performance, updated guidance, debt and cash-flow progress, and any company clarification on dividend policy
The next report is the clearest scheduled opportunity to evaluate whether recent results represent stabilization or a continuing deterioration. In the meantime, the new operating model is a medium-term execution catalyst rather than an already-realized earnings benefit. A dividend update could also affect how income-focused market participants assess GIS, particularly given the elevated yield and analyst warning.
Technical Outlook
Current Price: $34.32 vs 52-Week High: $49.59 (-30.8% from high)
Trend Analysis
Friday’s close was about 10.1% above the 52-week low of $31.18, leaving GIS much closer to the bottom than the top of its annual range. The stock gained 2.39% in Friday’s session and traded between $33.6101 and $34.445. This daily bounce is not enough to establish a sustained trend reversal. The supplied two-year return and distance from the 52-week high point to weak longer-term price momentum, while the latest closing level alone can’t confirm support.
Key Levels
- Resistance: $34.45 near Friday’s session high, then approximately $35.10 at the supplied analyst mean target
- Support: Approximately $33.61 near Friday’s session low, then $31.18 at the 52-week low
These are reference levels drawn from the supplied trading range and analyst targets, not technical guarantees. A break above or below them would need confirmation from subsequent trading and volume data, which were not provided.
Bull vs Bear Case
Bull Case
- Catalyst 1: Established brands and distribution may help the company maintain repeat demand and retail access.
- Catalyst 2: The September EPS beat and operating model changes provide a basis to monitor for better execution and cost efficiency.
- Catalyst 3: Reported free cash flow of about $1.30 billion and an analyst target range extending above the current price offer a counterpoint to recent weakness, though neither assures improved performance.
Bull Scenario Reference: $43, the supplied analyst high target, about 25.3% above Friday’s close
Bear Case
- Risk 1: Negative TTM EPS, falling revenue and sharply lower earnings growth indicate meaningful operating pressure.
- Risk 2: Debt, tight liquidity and the reported possibility of a dividend cut could weigh on the income-focused investor case.
- Risk 3: The stock is about 30.8% below its 52-week high, while the supplied analyst mean target implies only modest upside.
Bear Scenario Reference: $30, the supplied analyst low target, about 12.6% below Friday’s close
The targets above are analyst estimates used to frame a range of scenarios, not StockAlpha.ai forecasts. Which case carries more weight depends on whether GIS stabilizes sales and earnings while reducing leverage without undermining its brands or cash generation.
Risks to Consider
- Valuation Risk: A negative trailing P/E limits the usefulness of conventional earnings multiples, while forward valuation relies on estimates that may not be achieved. Analyst targets are dispersed and differ by data source.
- Competitive Risk: Other branded food companies and private-label products compete for shelf space and consumer spending. Pricing actions can support revenue but risk volume or share if customers switch to alternatives.
- Macro Risk: Inflation, commodity costs, interest rates and household budget pressure can affect input costs, purchasing behavior and financing expenses.
- Execution Risk: The new operating model and leadership changes could take time to deliver benefits. Cost reductions or strategic investment may not translate into profitable growth as intended.
Dividend-related uncertainty deserves separate attention. A 7.11% indicated yield may appear substantial, but yield moves with share price and does not guarantee that the current payout will continue. The reported 35% reduction possibility is attributed to Piper Sandler, not management; the negative TTM EPS, debt and free cash flow should be considered together rather than treating yield as a standalone measure of payout safety.
Bottom Line
Investment Verdict: BEARISH
GIS offers established brands, a recent quarterly EPS beat and reported free cash flow, but the current evidence is burdened by negative trailing earnings, declining revenue, substantial debt and uncertainty around the dividend. The analyst consensus is Hold and the supplied average price target is close to Friday’s close, while the company’s next earnings report and operating-model execution remain important tests. This report presents market analysis and data for informational purposes only; it is not investment advice.
Action Items for Investors
- Long-term investors: When evaluating the company, compare future sales, margin and free-cash-flow results with the stated efficiency goals, and check official disclosures for dividend and debt updates.
- Short-term traders: Friday’s range and the 52-week low provide reference points, not signals by themselves. The data supplied do not include enough moving-average or volume history to confirm a technical trend.
- Risk management: Assess the potential effects of earnings volatility, leverage and a possible payout change in the context of your own objectives and risk tolerance; this report cannot determine suitability for an individual.
What to Watch This Week
- Whether General Mills issues any formal clarification about its dividend policy or debt-reduction priorities.
- Trading around Friday’s $33.61 to $34.45 range as markets reopen Monday, November 16, noting that these levels are not guaranteed support or resistance.
- Any updates on the January 1, 2027 operating-model transition and the information investors may want to review before the expected December 23 earnings report.
Sources
Share this report
Share this article
Spread the word on social media
Think GIS will outperform? Prove it.
Free practice contests — earn Alpha CoinsExplore More Content
Disclaimer: StockAlpha.ai content is for informational and educational purposes only. It is not personalized investment advice. Sentiment ratings and market analysis reflect data-driven observations, not buy, sell, or hold recommendations. Always consult a qualified financial advisor before making investment decisions. Past performance does not guarantee future results.
Spotted something wrong? Report an error.