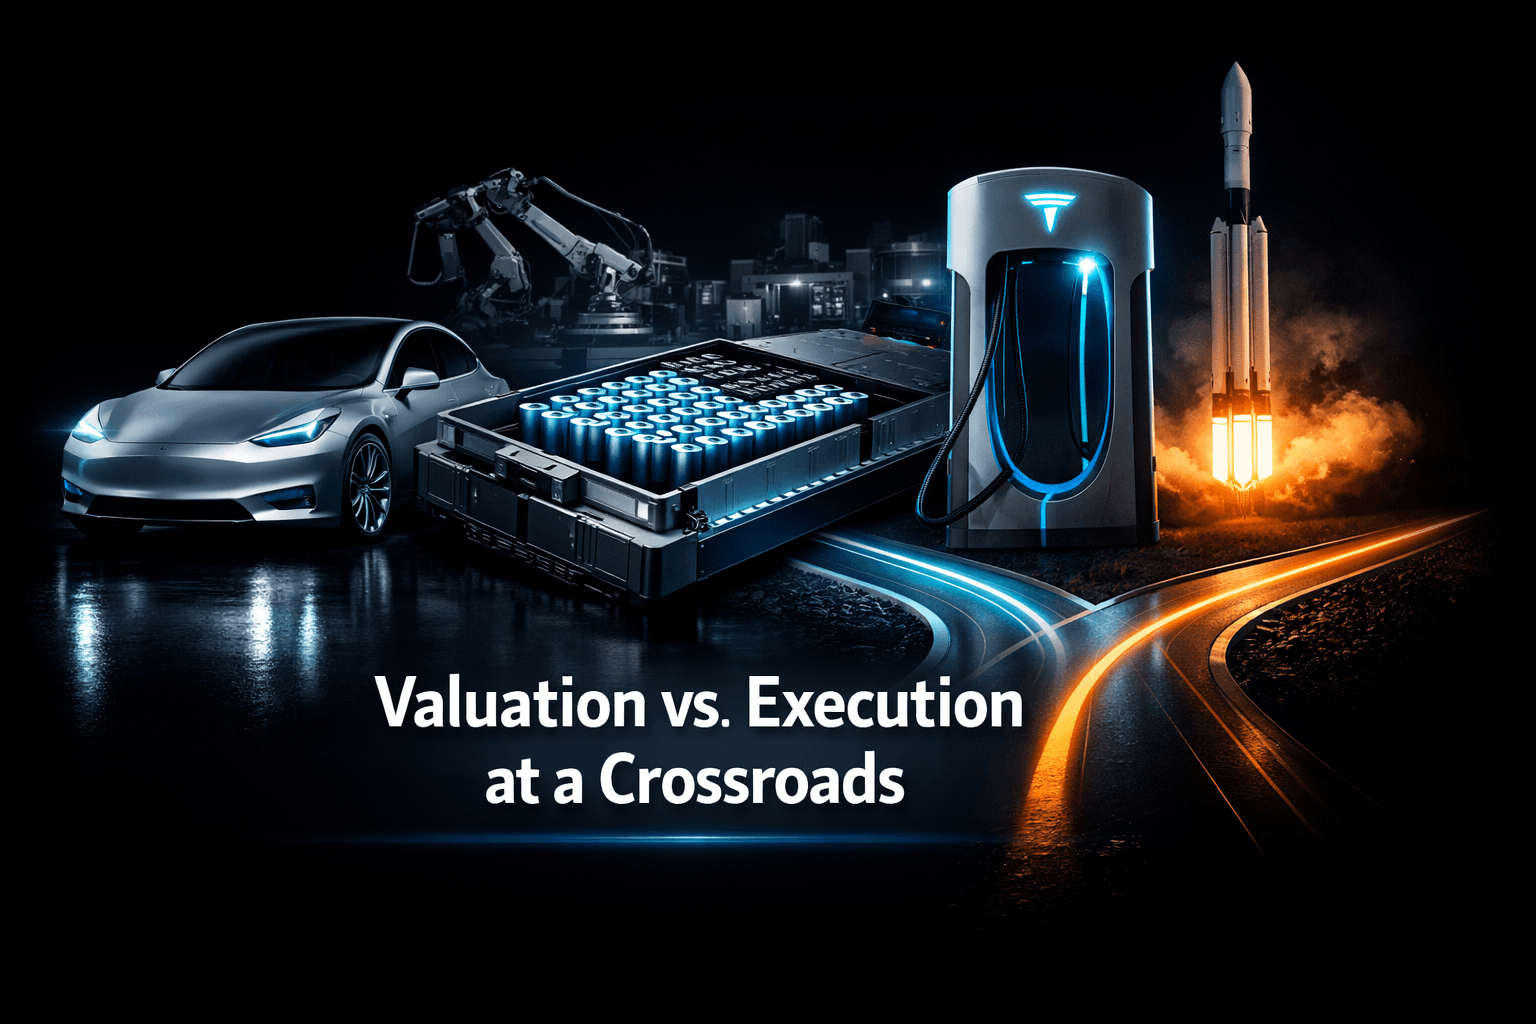
TSLA: Valuation vs. Execution at a Crossroads
TSLA is trading at $364.27 as of Friday, September 18, 2026, with analysts showing modest upside to the mean target. Revenue growth continues, but margins and competition are the key questions heading into the next catalysts.
Executive Summary
Investment Thesis: TSLA remains a dominant EV platform with strong U.S. market share and diversified growth initiatives from energy storage to robotics. Revenue growth is intact, but profit margins have compressed relative to historical levels, and competitive pressure from Chinese OEMs like BYD is accelerating. Analyst price targets imply modest upside to the average, leaving the risk/reward balanced for many investors as execution and margin recovery become the critical next moves.
Current Price: $364.27 (as of Friday, September 18, 2026) | Key Metric: Q2 FY26 Revenue $28.24B, Profit Margin 3.95% | Stance: NEUTRAL
Company Overview
TSLA designs, manufactures, and sells electric vehicles, energy storage products, and related services. The company also develops software-enabled features such as Full Self-Driving, and it is investing in humanoid robotics and AI-related initiatives that could expand its TAM over the coming years.
Key Products & Competitive Position
- Core Business: Electric passenger vehicles and related software and services.
- Key Products: Model S/3/X/Y family, energy storage products like Powerwall and Megapack, FSD software, and early-stage Optimus robotics.
- Competitive Moat: Vertical integration across vehicle software, battery manufacturing scale, strong brand recognition, an expanding supercharger network, and high U.S. market share reportedly near 52%.
Recent Developments
Key developments include continued volume growth in 2026, public commentary on a 55% FSD attach rate in some markets, and ongoing commentary about scaling Optimus. Analysts have reiterated ratings recently, with firms such as Piper Sandler and Goldman Sachs maintaining constructive stances. Competition from BYD and other low-cost manufacturers in China has intensified, and Tesla's margins have been under pressure compared with prior peaks.
Financial Snapshot
Revenue & Earnings Trends
Q2 FY26 revenue was $28.24 billion with GAAP net income of $1.11 billion, producing a profit margin of roughly 3.95%. That margin is meaningfully lower than Tesla's peak margins in prior years, reflecting pricing pressure, incentive programs in some regions, cost inflation in logistics and components, and competitive pricing moves. Two-year price history shows an average close around $362.47 and a total return of roughly 49% over 24 months, indicating resilient equity performance despite operating pressure.
Balance Sheet Highlights
Public data indicates Tesla carries substantial cash balances and a sizable installed base of capital equipment from factories in Fremont, Shanghai, Austin, and Berlin. Debt levels have been modest relative to industrial peers historically, but capex intensity remains a watch item as Tesla invests in battery gigafactories and scaling automation for Optimus. Free cash flow will be closely tied to capex cadence and margins over the next 12 months.
Valuation Analysis
Current Valuation Metrics
Historical Comparison
Current multiples are lower than the extreme valuation peaks seen in earlier years but remain above traditional automaker averages. Tesla's P/S and EV/EBITDA indicate that the market still prices future software and energy upside into the stock, even as near-term margins compress. Over the past five years Tesla's valuation has fluctuated widely, with the current forward P/E nearer to the long term average when you net out earlier froth.
Fair Value Estimate
A blended approach using a conservative DCF and multiples-based comparables yields a fair value range that centers near the analyst mean target of $396.94, implying roughly 9% upside from Friday's close. That estimate assumes margin recovery toward mid-single digits over 12 to 18 months, steady delivery growth, and modest contributions from energy and software revenue. If margins stay near current levels, the fair value would be closer to present levels or lower.
Competitive Landscape
Market Position
Market Share: ~52% U.S. EV share (reported) | Ranking: #1 in U.S. EV retail deliveries
Key Competitors
Competitive Advantages
- Moat 1: Vertical integration across batteries, vehicle software, and manufacturing, which supports unit economics at scale.
- Moat 2: Strong brand, high FSD attach interest, and an extensive supercharger network that enhance total ownership value.
- Moat 3: Software-defined vehicle platform and OTA update capability that can monetize features over time.
Earnings Track Record
Last 4 Quarters: 3 beats / 1 miss
Recent Earnings History
Guidance Trend
Management has emphasized delivery growth and capacity buildout over near-term margin guidance. Analysts note that guidance has been conservative at times, but the company has also signaled continued investment in R&D and capex for robots and new fabs. Watch for whether guidance tightens toward margin recovery or remains focused on volume and technology rollouts.
Analyst Sentiment
Consensus Rating:
Price Targets
- Low: $125.00
- Mean: $396.94 (+9.0% upside)
- High: $600.00
Recent Analyst Actions
Goldman Sachs reiterated coverage on 9/16/2026, and Piper Sandler lists an Overweight rating in recent summaries. Brokerage note commentary has focused on FSD adoption rates, Optimus optionality, and whether pricing competition in China will compress margins further. Analysts remain split between emphasizing long-term platform optionality and near-term margin risk.
Recent News & Catalysts
Key Developments
- Q2 FY26 Results: Revenue $28.24B, GAAP EPS $0.33, profit margin 3.95%, representing a notable miss versus the EPS estimate of $0.54.
- Market Commentary: Reports show Tesla holding roughly 52% U.S. EV market share, even as Chinese OEMs expand globally.
- Analyst Targets: Analyst coverage shows a wide price target range, from $125 low to $600 high, signaling divergent views on execution and optionality.
Upcoming Catalysts
Next Earnings: Q3 FY26 target window likely in late October 2026 | Key Events: Q3 delivery figures, margin commentary, FSD feature rollouts, China demand updates, and any new details on Optimus commercialization timelines.
Technical Outlook
Current Price: $364.27 vs 52-Week High: $489.88 (-25.6% from high)
Trend Analysis
Price has retraced from the 52-week high and is trading near the two-year average close. Momentum indicators have cooled from earlier strength, reflecting investor caution around margins and competitive dynamics. Trading volume patterns over the past year show continued retail interest, but large swings on news events remain common.
Key Levels
- Resistance: $390, $420
- Support: $340, $300
Bull vs Bear Case
Bull Case
- Catalyst 1: Continued delivery growth and more efficient factories drive margin recovery, lifting EPS and justifying higher multiples.
- Catalyst 2: FSD and software monetization expand recurring revenue and improve lifetime customer value.
- Catalyst 3: Optimus or energy storage scale provides optional upside beyond core vehicle economics, supporting premium valuation.
Bull Target: $600 (+64% from current)
Bear Case
- Risk 1: Intensifying price competition, particularly from BYD, leads to sustained margin compression and slower revenue growth.
- Risk 2: Regulatory and litigation risks tied to FSD slow adoption and add costs, hitting profitability.
- Risk 3: High valuation premia are disappointed if optionality from robotics and energy fails to scale as priced in.
Bear Target: $125 (-66% from current)
Risks to Consider
- Valuation Risk: Current multiples assume successful execution on software and energy optionality. If scale or monetization stalls, downside could be steep.
- Competitive Risk: BYD and other lower-cost entrants are aggressively expanding, particularly in China, placing pricing pressure on Tesla's core segments.
- Macro Risk: EV demand is sensitive to consumer credit conditions and incentives. Slower macro growth or evaporating incentives could depress volumes.
- Execution Risk: Factory ramps, supply chain effects, and FSD development timelines carry schedule and cost risk that can impact margins and cash flow.
Bottom Line
Investment Verdict: NEUTRAL
TSLA remains a market leader in EVs with significant long-term optionality in software and energy. Near term, mixed earnings, lower margins, and intensifying competition balance the upside implied by analyst targets. The stock looks fairly priced for an investor who values optionality, while those focused on near-term fundamentals may find the risk profile elevated.
Action Items for Investors
- Long-term investors: Monitor margin recovery, FSD monetization metrics, and evidence of scaled energy or robotics revenue before altering position sizes. Think in terms of multi-year optionality, not quarter to quarter operating noise.
- Short-term traders: Watch delivery figures and guidance beats or misses for volatility catalysts, and use clearly defined stop-loss levels given the stock's history of large moves.
- Risk management: Diversify exposure and size positions so that single events like a missed quarter or regulatory setback do not overweight your portfolio. Analysts note that volatility remains elevated.
What to Watch This Week
- Any updated public comments on FSD adoption and attach rate disclosures.
- Headlines on China demand and BYD competitive moves.
- Analyst note updates from major houses, particularly any changes to price targets and margin assumptions.
Sources
Share this report
Share this article
Spread the word on social media
Think TSLA will outperform? Prove it.
Free practice contests — earn Alpha CoinsExplore More Content
Disclaimer: StockAlpha.ai content is for informational and educational purposes only. It is not personalized investment advice. Sentiment ratings and market analysis reflect data-driven observations, not buy, sell, or hold recommendations. Always consult a qualified financial advisor before making investment decisions. Past performance does not guarantee future results.