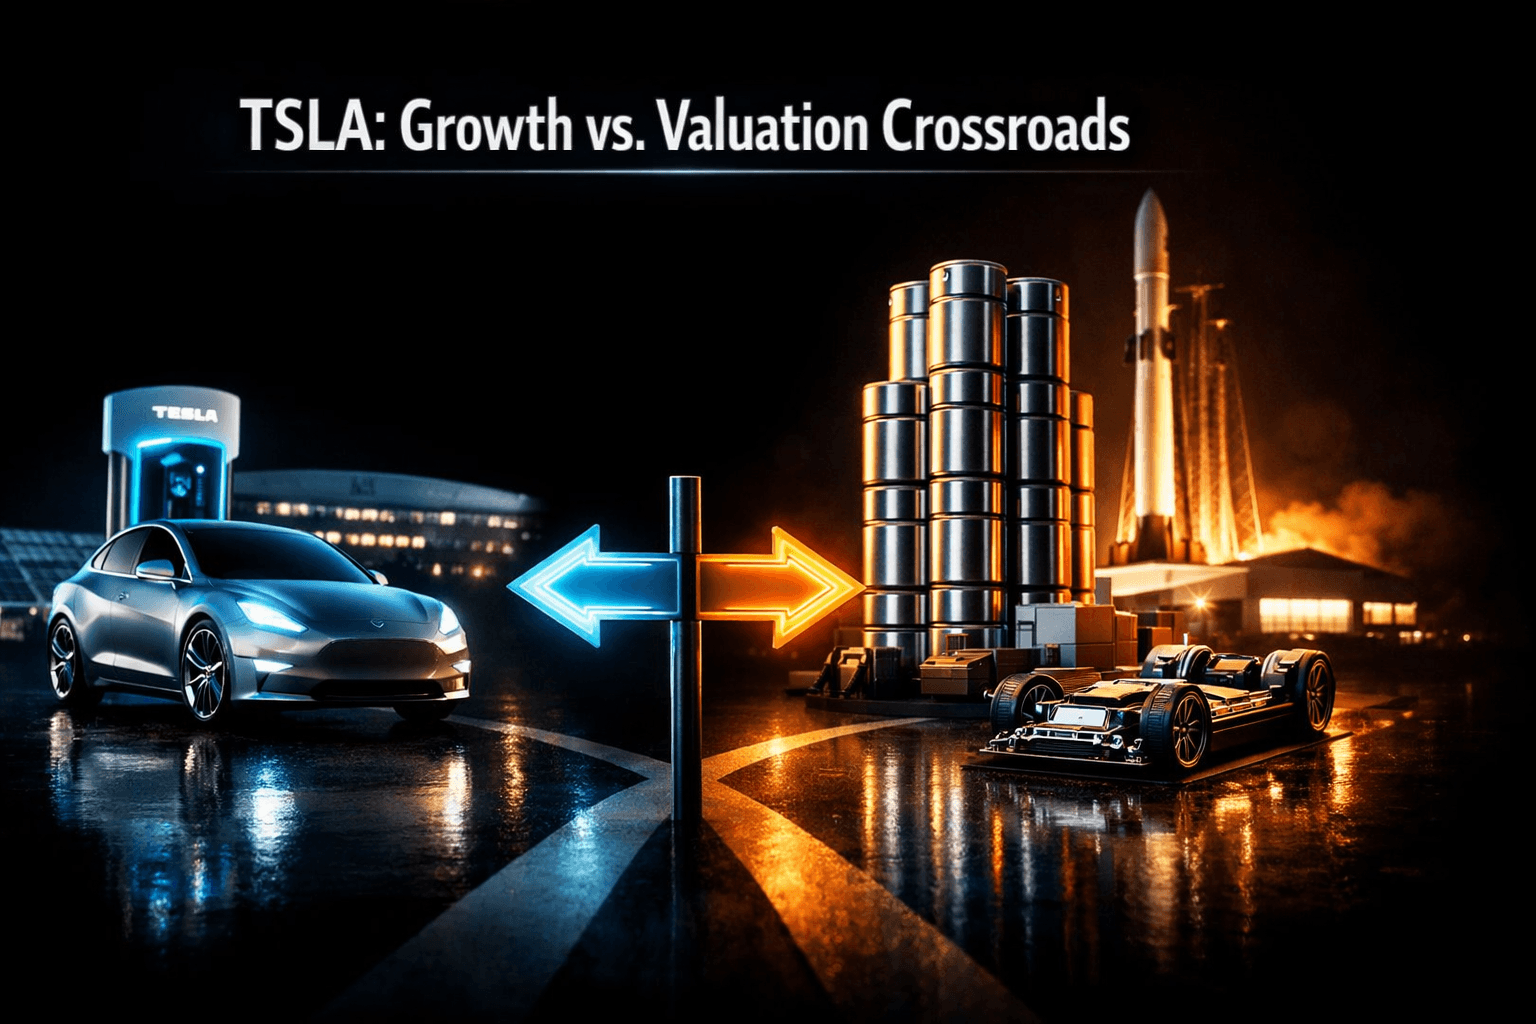
TSLA: Growth vs. Valuation Crossroads
Tesla ($TSLA) is trading at $362.86 as of Friday, August 21, with revenue momentum but stretched valuation metrics and mixed analyst views. This report weighs growth levers, margin risks, and near-term catalysts to present a balanced view for retail investors.
Executive Summary
Investment Thesis: Tesla remains the dominant EV platform with broad revenue streams from vehicles, energy storage, and software. Strong top-line growth and a $40+ billion cash buffer support execution through cyclical slowdowns, but margins are under pressure and the stock trades at rich multiples that embed aggressive growth expectations. Near-term catalysts include margin recovery, new vehicle launches, and incremental software sales, while regulatory scrutiny, competition, and valuation compression are key headwinds.
Current Price: $362.86 as of Friday, August 21 | Key Metric: Price/Sales 11.78 | Stance: NEUTRAL
Company Overview
Tesla, Inc. designs, manufactures, and sells electric vehicles, energy storage products, and solar systems. The company also develops Autopilot and Full Self-Driving software and operates an expanding charging network.
Key Products & Competitive Position
- Core Business: Vehicle manufacturing and sales, complemented by recurring software and energy products.
- Key Products: Model S, 3, X, Y, Cybertruck, Powerwall, Megapack, Solar Roof, Autopilot and FSD subscriptions.
- Competitive Moat: Brand recognition, vertical integration across battery, vehicle software and manufacturing, scale in EV production, global Supercharger network, and a growing software revenue stream.
Recent Developments
Tesla delivered solid top-line growth through fiscal 2026 while operating margins compressed. Management continued investments in new factories and battery R&D, and the company has been expanding software subscription offerings. Regulatory dialogues about autonomy and price adjustments on vehicle lines remain ongoing heading into the long weekend.
Financial Snapshot
Revenue & Earnings Trends
Tesla reported trailing twelve month revenue of about $103.6 billion and net income near $3.8 billion, implying a slim net margin roughly 3.7%. Q2 FY26 revenue was reported at $28.24 billion with GAAP earnings of about $1.11 billion, reflecting ongoing unit growth but margin pressure from price changes and cost inflation. Levered free cash flow is positive at roughly $4.8 billion over the trailing year, but free cash flow per vehicle has compressed relative to peak levels.
Balance Sheet Highlights
The balance sheet is a core strength. Tesla holds about $43.5 billion in cash and equivalents and has modest leverage, with total debt to equity near 18.4 percent. The cash cushion supports capex for new plants and continued R&D spending on batteries and autonomy, providing a buffer against cyclical weakness.
Valuation Analysis
Current Valuation Metrics
Historical Comparison
Tesla currently trades at multiples well above traditional auto manufacturers and above its own historical average on most measures. Trailing P/E near 320 and forward P/E above 175 are considerably higher than five-year averages for auto peers. The market is pricing in sustained high growth and margin expansion, which leaves valuation vulnerable if execution or growth falter.
Fair Value Estimate
An illustrative fair value assessment blends multiples and discounted cash flow intuition. If Tesla sustains mid-to-high teens revenue growth and gradually improves operating margins toward 8 to 10 percent over several years, a forward multiple in the 30 to 50 range could be defendable, implying a materially lower valuation than today. Conversely, if software and energy revenues accelerate faster than expected, higher multiples could be justified. Given the wide outcome range, a fair value band is more appropriate than a single point estimate.
Competitive Landscape
Market Position
Market Share: meaningful share among global EVs, variable by market | Ranking: #1 in many EV segments
Key Competitors
Competitive Advantages
- Moat 1: Vertical integration in battery and manufacturing reduces dependency on suppliers.
- Moat 2: Software platform and over-the-air capabilities create recurring revenue potential.
- Moat 3: Global Supercharger network and brand strength enhance ownership economics and resale value.
Earnings Track Record
Last 4 Quarters: 3 beats / 1 misses
Recent Earnings History
Guidance Trend
Management’s guidance has emphasized unit growth and factory ramping while warning investors about short-term margin volatility. Analysts have adjusted estimates for lower near-term margins and pushed some longer-term profit expectations down, which partly explains the wide spread of price targets.
Analyst Sentiment
Consensus Rating:
Price Targets
- Low: $125
- Mean: $395.34 (+9% upside)
- High: $600
Recent Analyst Actions
Notable divergence among analysts continues. On 8/18/2026 GLJ Research reiterated a Sell rating with a price target of $24.86, while consensus across the analyst universe remains around a mean target near $395. This split reflects polarized views on margin sustainability and the value of Tesla's software and energy optionality.
Recent News & Catalysts
Key Developments
- Q2 Results: Revenue of $28.24B and GAAP net income of $1.11B, margins compressed to the mid-single digits.
- Analyst Moves: GLJ Research reiterated a Sell on 8/18/2026, highlighting valuation concerns and cutting its target.
- Product & Scale: Continued factory ramps and battery R&D investment, plus ongoing expansions of charging and service footprint.
Upcoming Catalysts
Next Earnings: Next quarter date to be confirmed | Key Events: margin commentary, vehicle delivery outlook, software subscription growth, and any updates on autonomy regulatory progress
Technical Outlook
Current Price: $362.86 as of Friday, August 21 vs 52-Week High: $489.88 (-26% from high)
Trend Analysis
Price action shows a recovery bounce from the mid-200s low during the 52-week period, and the recent move higher indicates renewed momentum into quarter-end. The longer-term trend remains positive versus multi-year levels, but the stock is materially off the 52-week peak which keeps upside contingent on growth and margin improvements.
Key Levels
- Resistance: $400, $450
- Support: $320, $280
Bull vs Bear Case
Bull Case
- Catalyst 1: Software and FSD subscriptions scale quickly, turning a larger share of vehicle sales into recurring revenue.
- Catalyst 2: Battery cost declines and improved factory efficiency boost margins toward double digits.
- Catalyst 3: Energy storage and commercial deployments accelerate, diversifying revenue and improving valuation multiples.
Bull Target: $600 (+65%)
Bear Case
- Risk 1: Continued margin erosion from price cuts and higher input costs reduces profitability and investor enthusiasm.
- Risk 2: Intensifying competition from legacy and new EV entrants pressures market share and pricing power.
- Risk 3: Valuation contraction if growth disappoints or if markets de-rate high-multiple growth names.
Bear Target: $125 (-66%)
Risks to Consider
- Valuation Risk: Extremely elevated multiples mean the stock already prices in substantial future growth and margin expansion. Any slowdown could trigger sharp re-pricing.
- Competitive Risk: Incumbent automakers and new EV startups are accelerating investments. Price competition and alternative technologies may compress Tesla’s advantage.
- Macro Risk: Economic weakness, higher interest rates, or consumer spending pullbacks could reduce vehicle demand and delay fleet replacement cycles.
- Execution Risk: Factory ramp issues, supply chain disruption, or slower than expected software monetization would hit earnings and cash flow.
Bottom Line
Investment Verdict: NEUTRAL
Tesla is a market leader with diversified growth avenues and a strong balance sheet, but it trades at very elevated multiples that already reflect aggressive future outcomes. Analysts remain split, and near-term margin commentary and product cadence will drive sentiment more than headline unit growth alone.
Action Items for Investors
- Long-term investors: Monitor product roadmaps, software monetization trends, and margin recovery. Use valuation drip-buying if you prefer dollar cost averaging into long-term exposure.
- Short-term traders: Watch earnings reaction, resistance at $400, and support near $320 for tactical entries or risk-managed swing trades.
- Risk management: Consider position sizing that reflects the stock’s volatility and set stop-loss levels consistent with your risk tolerance.
What to Watch This Week
- Any follow-up commentary from management or analyst notes after Q2 results and the 8/18/2026 GLJ Research action.
- Updates on FSD regulatory and approval developments that could materially change the software revenue outlook.
- Macro cues such as consumer sentiment and interest rate commentary that affect high multiple growth stocks.
Can Tesla keep delivering strong revenue growth while its valuation compresses? That is the central question for shareholders over the next several quarters. Data suggests there are clear strengths but also real execution and valuation risks to monitor closely.
Disclaimer: This report provides analysis and information only. It does not constitute an offer or solicitation to buy or sell securities, nor is it personalized investment advice. Analysts note that data and opinions can change and readers should perform their own due diligence before acting.
Sources
Share this report
Share this article
Spread the word on social media
Think TSLA will outperform? Prove it.
Free practice contests — earn Alpha CoinsExplore More Content
Disclaimer: StockAlpha.ai content is for informational and educational purposes only. It is not personalized investment advice. Sentiment ratings and market analysis reflect data-driven observations, not buy, sell, or hold recommendations. Always consult a qualified financial advisor before making investment decisions. Past performance does not guarantee future results.