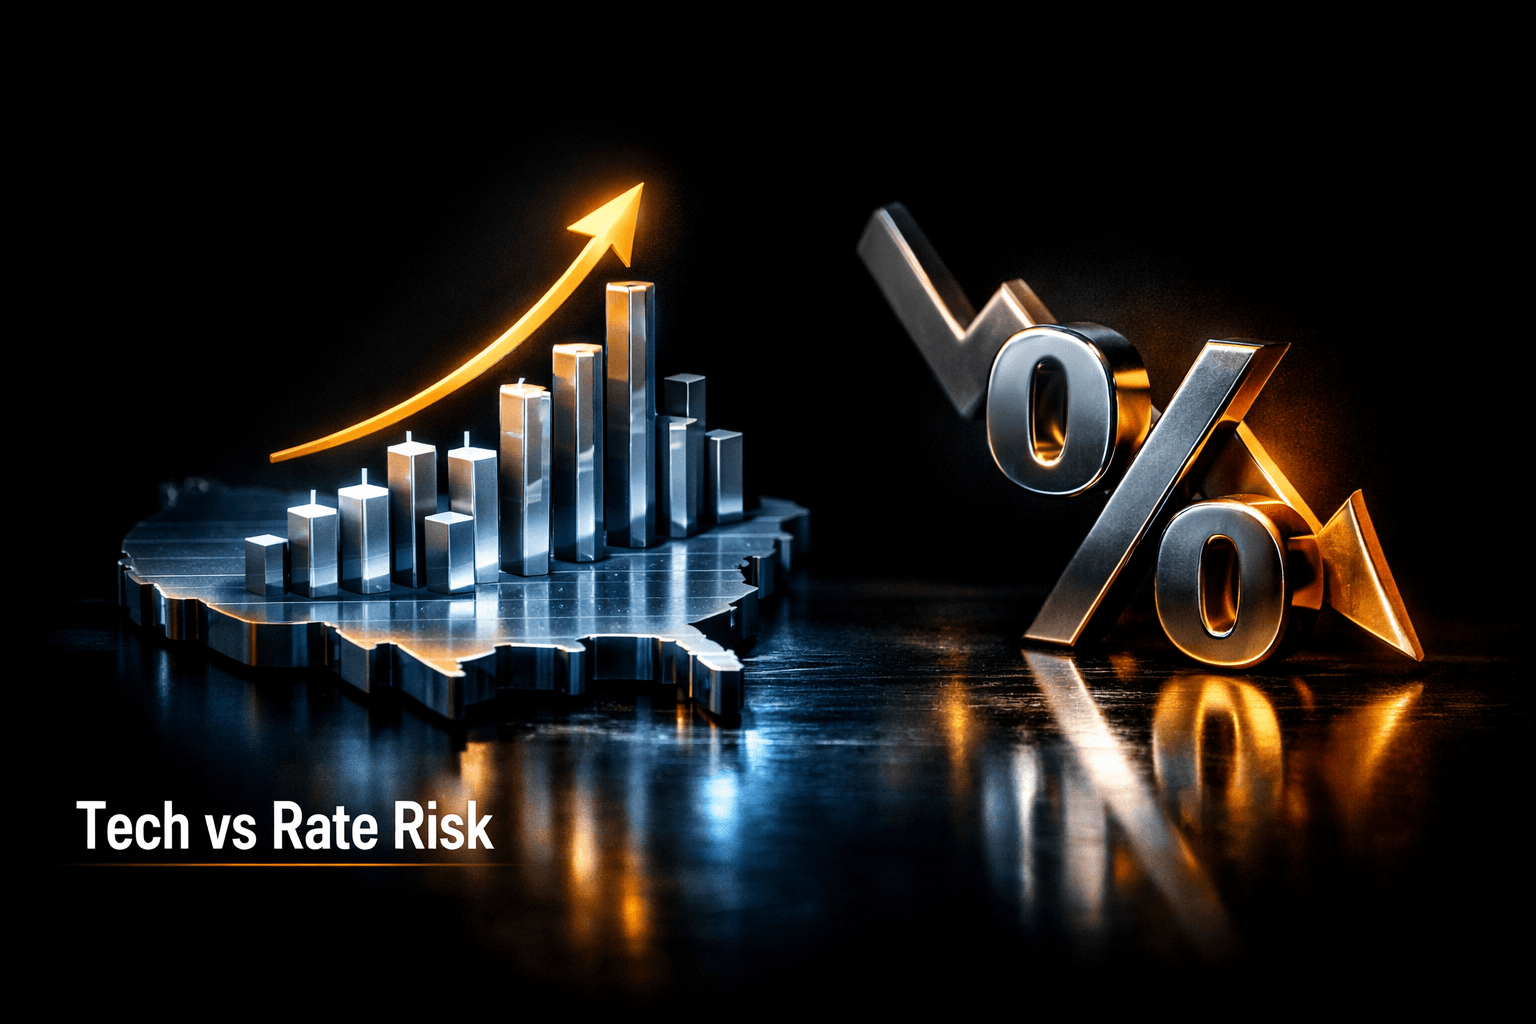
SPY: S&P 500 Outlook — Tech Strength vs Rate Risk
SPY sits near recent highs with strong tech leadership and AI-driven momentum counterbalanced by evolving Fed rate expectations and credit market stress. This report breaks down valuation, catalysts, and risks for retail investors.
Executive Summary
Investment Thesis: SPY provides broad exposure to the S&P 500, which continues to be driven by a concentrated leadership cohort in technology and AI-related names. Momentum in semiconductors and mega-cap software is lifting headline performance, but a renewed hawkish tilt in Fed pricing and pockets of stress in private credit create near-term volatility risk. Given the ETF's diversification and low tracking cost, SPY remains a core equity benchmark for market exposure, though upside appears modest from current levels absent new macro catalysts.
Current Price: $662.29 | Key Metric: Beta 1.02 | Stance: NEUTRAL
Company Overview
$SPY is the SPDR S&P 500 ETF Trust, an exchange traded fund designed to track the S&P 500 Index. It offers investors a low-cost, liquid vehicle to gain broad large-cap U.S. equity exposure across sectors.
Key Products & Competitive Position
- Core Business: Passive replication of the S&P 500 Index through a portfolio of large-cap U.S. stocks weighted by market capitalization.
- Key Products: The primary product is the SPDR S&P 500 ETF share class, which trades under $SPY and offers intraday liquidity and tight bid ask spreads.
- Competitive Moat: Scale and liquidity, with deep secondary market trading and broad institutional and retail adoption. Low cost relative to active alternatives gives it structural distribution advantages.
Recent Developments
Market commentary over the last week highlights intense demand for AI compute, notably near zero availability for Nvidia GPUs, which supports tech leadership inside the index. At the same time researchers and strategists are signaling a potential shift in the Fed rate outlook as oil and money market spreads reprice expectations for rate cuts. Separately, strain in private credit and BDC discounts is drawing attention to credit contagion risks that could amplify risk-off moves for equities.
Financial Snapshot
Revenue & Earnings Trends
$SPY itself does not generate revenue like an operating company, because it is an ETF that tracks the S&P 500. Performance therefore mirrors the aggregated revenues and earnings of the index constituents. Over the last two years the S&P 500 has produced a roughly 31.8% total return, driven by a rebound in earnings and outsized gains in a relatively small cohort of mega caps. Analysts note earnings growth has been uneven across sectors, with cyclicals lagging while tech and communications services show outsized margin expansion.
Balance Sheet Highlights
The ETF is passively managed and holds a basket of equities. Its balance sheet considerations are limited to cash holdings for distributions and operational reserves. Liquidity and AUM are the key asset metrics, and SPY continues to rank among the largest ETFs by assets under management, supporting tight spreads and execution efficiency for investors.
Valuation Analysis
Current Valuation Metrics
Historical Comparison
Current forward multiples sit modestly above five year averages, reflecting elevated valuations for mega cap technology names relative to the broader index. The 52-week high near $697 represented a stretched multiple during peak AI enthusiasm. Price volatility has increased when market expectations for interest rates shift, which influences the discount rate applied to future earnings.
Fair Value Estimate
Combining multiples and a sector weighted DCF approach suggests fair value for $SPY lies in a narrow band around $650 to $690, depending on near term earnings momentum and terminal growth assumptions. Using consensus EPS growth forecasts and a slightly higher discount rate to reflect elevated rate uncertainty yields a midpoint near $670. That implies limited upside from the current $662 level without incremental earnings beats or a clearer Fed pivot to easing.
Competitive Landscape
Market Position
Market Share: Dominant in large cap passive ETF flows | Ranking: #1 in S&P 500 ETF liquidity and one of the largest ETFs globally
Key Competitors
Competitive Advantages
- Moat 1: Scale and liquidity, which support low trading costs for large orders.
- Moat 2: Brand recognition and institutional adoption, which drive steady inflows and resiliency in flows.
- Moat 3: Tight tracking and transparent methodology, making it a go to vehicle for S&P 500 exposure.
Earnings Track Record
Last 4 Quarters: 3 beats / 1 misses
Recent Earnings History
Guidance Trend
Managements of index constituents have issued mixed guidance, with technology firms signaling continued investment in AI and cloud scaling, while industrial and consumer names are more cautious. Aggregate guidance revisions have shown slight upward momentum in earnings estimates for the next 12 months, but downward revisions are possible if macro data weakens or Fed policy tightens further.
Analyst Sentiment
Consensus Rating:
Price Targets
- Low: $620
- Mean: $675 (+1.9% upside)
- High: $725
Recent Analyst Actions
Analysts have been recalibrating exposure recommendations inside portfolios rather than altering S&P 500 ETF ratings materially. Some boutiques increased allocation to AI oriented baskets after data showing severe GPU shortages. Others flagged rising oil prices and money market spreads as reasons to reduce duration and trade defensively. The net effect has been a cautious tone toward multiple expansion despite earnings resilience.
Recent News & Catalysts
Key Developments
- Nvidia GPU constraints: Real time GPU availability is near zero, according to 3Fourteen Research, amplifying the AI investment narrative and supporting semiconductor and AI software demand.
- Fed rate outlook shift: Surging oil and SOFR spreads are prompting market participants to price fewer 2026 rate cuts and to consider a more neutral or even hawkish stance later this year.
- Private credit stress: Redemption pressure and loan markdowns in private credit and BDCs raise concerns around contagion into banks and liquidity markets.
Upcoming Catalysts
Next Earnings: Quarterly earnings season for the S&P 500 begins late April | Key Events: Fed minutes, CPI and PCE inflation prints, Nvidia and semiconductor cycle updates
Technical Outlook
Current Price: $662.29 vs 52-Week High: $697.84 (-5.2% from high)
Trend Analysis
Price action shows a higher low since the April 2025 cycle low, and momentum indicators remain positive across several time frames. The rally is narrow, concentrated in a few mega caps that represent a large share of index performance. That concentration amplifies upside when leaders extend gains and amplifies downside when leadership stalls or macro risk reemerges. Volatility has ticked up with macro news flow, which means risk adjusted returns are now more sensitive to rate and credit signals.
Key Levels
- Resistance: $675, $695
- Support: $640, $610
Bull vs Bear Case
Bull Case
- Catalyst 1: Continued AI and cloud investment, especially as GPU constraints keep enterprise demand intact, boosting revenue for large cap tech.
- Catalyst 2: Earnings upgrades across the index as efficiency gains and software monetization lift margins.
- Catalyst 3: Modest multiple expansion if inflation cools and the Fed signals eventual cuts, which would push fair value above $700.
Bull Target: $725 (+9.4%)
Bear Case
- Risk 1: A pivot to a more hawkish Fed stance due to higher oil and sticky inflation, compressing equity multiples and dragging the index lower.
- Risk 2: Credit market stress that pressures financials and reduces liquidity, prompting broader risk off flows.
- Risk 3: Overreliance on a handful of mega caps for index returns, creating concentrated downside if leadership falters.
Bear Target: $620 (-6.4%)
Risks to Consider
- Valuation Risk: Elevated forward multiples relative to longer term averages mean the index is sensitive to weaker growth or higher rates.
- Competitive Risk: Sector concentration increases dependence on a small number of companies to drive returns, which raises single stock and sector risk within the ETF.
- Macro Risk: A change in the Fed narrative, rising oil, or renewed credit market instability could trigger rapid repricing across equities.
- Execution Risk: For ETF investors, intraday volatility and tracking differences during stressed market conditions can widen realized slippage, especially for very large trades.
Bottom Line
Investment Verdict: NEUTRAL
$SPY remains the most efficient, liquid vehicle to access U.S. large caps, and analysts note it will continue to serve as a core allocation for diversified portfolios. Current price sits near fair value under base case assumptions, with upside dependent on sustained earnings beats and a clearer Fed easing narrative. At the same time, macro uncertainties and credit market stress mean downside is meaningful if sentiment shifts.
Action Items for Investors
- Long-term investors: Consider maintaining strategic allocations to broad U.S. equities while reviewing sector and concentration risk within your portfolio.
- Short-term traders: Watch technical levels and volatility. Trading opportunities may arise around CPI, Fed minutes, and major earnings beats or misses.
- Risk management: Use position sizing, stop discipline, and consider diversifying with non correlated assets to manage drawdown risk.
What to Watch This Week
- CPI and PCE inflation prints and market reaction to them
- Any fresh data on GPU supply or semiconductor order books that could affect tech leadership
- Developments in private credit and BDC markets that could signal broader credit stress
Sources
Share this report
Share this article
Spread the word on social media
Think SPY will outperform? Prove it.
Free practice contests — earn Alpha CoinsExplore More Content
Disclaimer: StockAlpha.ai content is for informational and educational purposes only. It is not personalized investment advice. Sentiment ratings and market analysis reflect data-driven observations, not buy, sell, or hold recommendations. Always consult a qualified financial advisor before making investment decisions. Past performance does not guarantee future results.