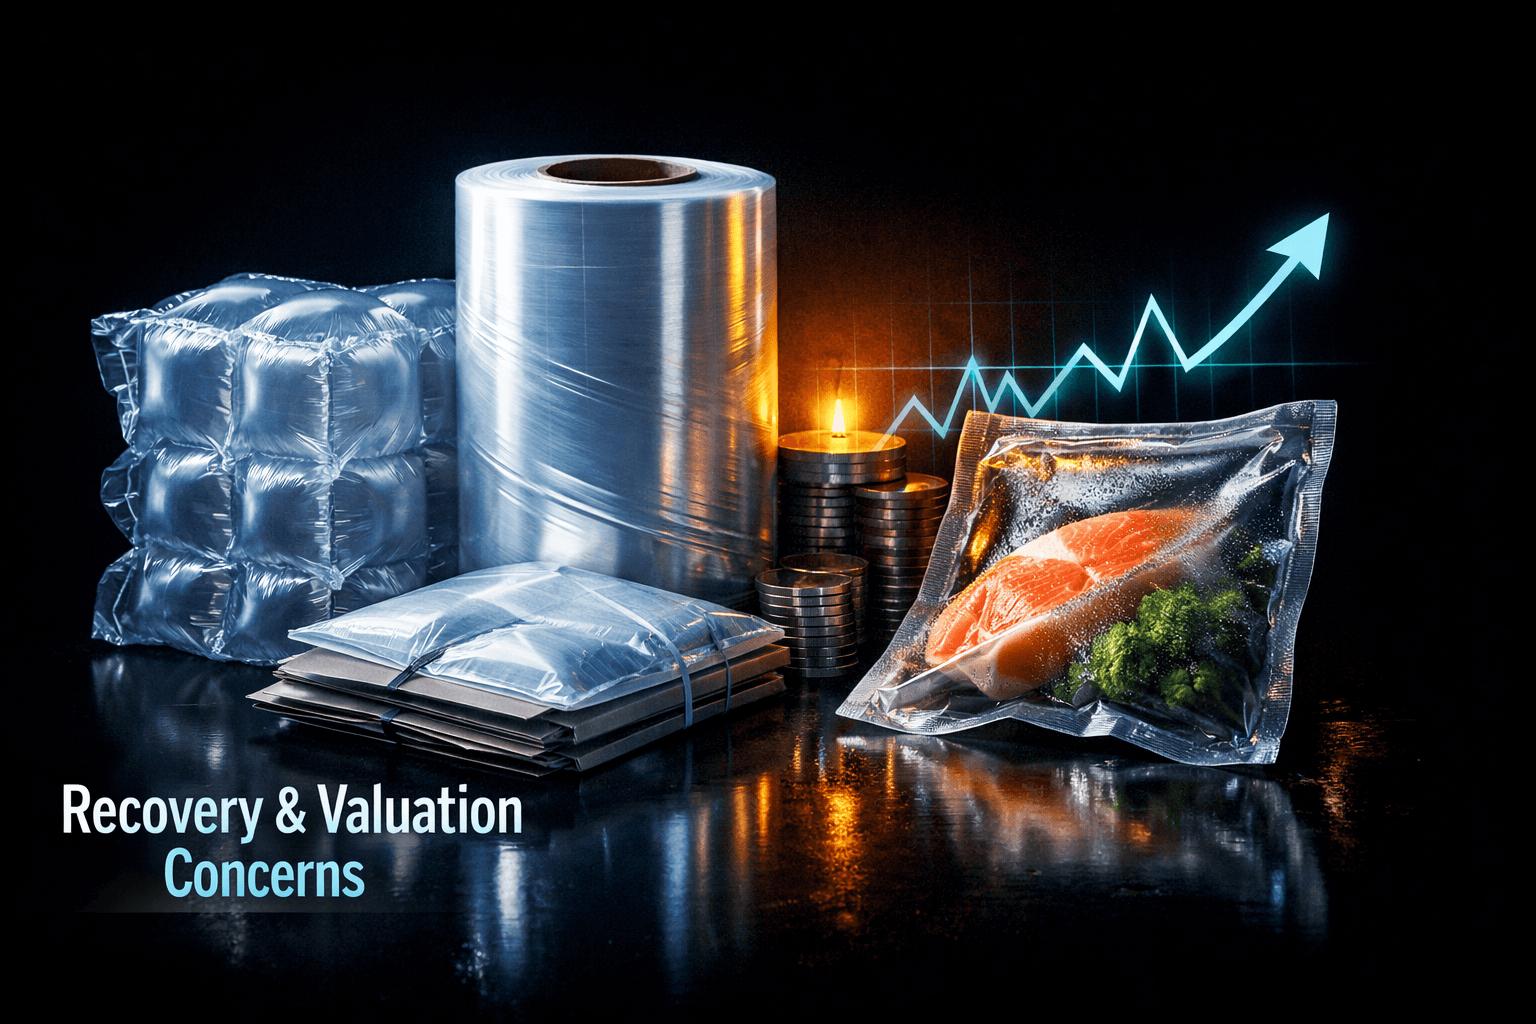
SEE: Recovery Holds, Valuation and Debt in Focus
Sealed Air ($SEE) has recovered strongly from 2025 lows and is trading near analyst targets, with a P/E of 12.2 and ROE near 48%. The setup is mixed: margin and cash flow improvement support the case, while high leverage and liquidity metrics temper the outlook.
Executive Summary
Investment Thesis: Sealed Air ($SEE) has shown durable operational improvement, driven by pricing and cost discipline, which produced recent earnings beats and a material recovery from 2025 lows. Valuation looks reasonable at a trailing P/E of 12.2 and forward multiples near 12, giving limited near term upside to consensus targets. The balance sheet is the primary watch point, with high leverage and a current ratio under 1 that could constrain flexibility in tougher macro windows. Investors should weigh the steadying margin and free cash flow story against balance sheet and cyclicality risks.
Current Price: $41.84 | Key Metric: P/E 12.20 | Stance: NEUTRAL
Company Overview
Sealed Air Corporation ($SEE) designs and manufactures protective and food packaging solutions for a broad set of industrial, retail and foodservice customers around the world. The company is best known for its inflatable protective packaging, automated systems and a growing portfolio of sustainable packaging offerings.
Key Products & Competitive Position
- Core Business: Protective packaging, food packaging and automated packaging systems sold to industrial and consumer-facing customers.
- Key Products: Bubble cushioning and protective films, Cryovac food packaging, automated portioning and sealing equipment, and material innovations aimed at recyclability.
- Competitive Moat: Strong channel relationships with large CPG and industrial customers, scale manufacturing footprint, and a brand recognized for protective performance and regulatory-compliant food packaging.
Recent Developments
Q4 2025 results showed an EPS beat at $0.77 versus estimate $0.7384, which reinforced the narrative of margin recovery. Analysts have responded with modest target increases, and the stock has climbed from a 52-week low of $22.78 to a high of $44.27 last November. Management continues to emphasize productivity, pricing and innovation, and the next earnings report is expected before market open on May 4, 2026.
Financial Snapshot
Revenue & Earnings Trends
Sealed Air generated roughly $5.3 billion in revenue on a trailing basis, with net income in the mid hundreds of millions. Recent quarters show improving operating margins from cost actions and pricing that offset input cost variability. EPS has rebounded and the company beat estimates in Q4 2025. Year to date returns are positive, and the one year performance is strong at roughly +26% through early 2026.
Balance Sheet Highlights
The balance sheet is a mixed story. Cash balances are limited relative to total liabilities, and leverage metrics remain high. Yahoo Finance data from late 2025 indicated total debt to equity in the high hundreds of percent range and an enterprise value roughly $10.2 billion, implying meaningful fixed obligations. The current ratio of 0.91 signals short term liquidity below 1, so working capital dynamics and access to committed credit will be important if volumes soften.
Valuation Analysis
Current Valuation Metrics
Historical Comparison
SEE's trailing and forward P/E multiple sits below many growth peers and below levels it traded at during prior multi-year recoveries. That compression reflects prior volatility and balance sheet concerns, even as earnings have improved. Relative to a five year average P/E, current multiples are modestly below trend, which partially explains why consensus targets are only several percent above the current price.
Fair Value Estimate
Using a blended approach that considers a normalized P/E in the 13-15x range on trailing EPS of $3.43, a reasonable fair value range is roughly $44 to $52 per share, with a midpoint near $48. That sits near analyst targets and implies limited but nontrivial upside if margins and cash generation sustain.
Competitive Landscape
Market Position
Market Share: meaningful in protective and food packaging segments | Ranking: Top 3 in key product verticals
Key Competitors
Competitive Advantages
- Moat 1: Scale manufacturing and supply chain relationships that support large account contracts.
- Moat 2: Product innovation in protective and food packaging that meets regulatory and sustainability demands.
- Moat 3: Cross-sell opportunities across industrial and foodservice customers and installed base of automated systems.
Earnings Track Record
Last 4 Quarters: 3 beats / 1 misses
Recent Earnings History
Guidance Trend
Management has been cautious on formal multi-year guidance, focusing instead on margin cadence and cash generation. Analysts have nudged targets higher after recent beats, but forward guidance revisions have been modest, keeping expectations grounded. The next report on May 4, 2026 will be the next clear read on management's near term outlook.
Analyst Sentiment
Consensus Rating:
Price Targets
- Low: $42.00
- Mean: $45.36 (+8.4% upside)
- High: $52.00
Recent Analyst Actions
Truist maintained a Buy rating and raised its price target in early January 2026, reflecting confidence in margin improvement. Overall the analyst base is mixed, with a meaningful number of Holds indicating that upside is viewed as modest relative to the risks.
Recent News & Catalysts
Key Developments
- Q4 2025 Beat: EPS $0.77 vs $0.7384 est, evidence of pricing and cost discipline.
- Analyst Target Moves: Several firms nudged targets higher after sequential beats, helping sentiment.
- Sustainability & Product Innovation: Ongoing investments in recyclable and food-safe packaging support win rates in retail and foodservice channels.
Upcoming Catalysts
Next Earnings: 2026-05-04 Before Market | Key Events: Q1 results, updated guidance or commentary on input costs and working capital, any commentary on M&A or capital allocation plans
Technical Outlook
Current Price: $41.84 vs 52-Week High: $44.27 (-5.5% from high)
Trend Analysis
The stock has shown a multi-month uptrend from the 2025 low, but price action has been consolidative around the low $40s. Momentum indicators signal stabilization rather than a strong breakout. Volume patterns suggest reduced selling pressure compared with the earlier drawdown.
Key Levels
- Resistance: $44.3, $48.0
- Support: $40.0, $36.0, $23.0
Bull vs Bear Case
Bull Case
- Catalyst 1: Continued margin expansion from pricing and productivity drives higher EPS and cash flow.
- Catalyst 2: Debt reduction and better working capital convert into more optionality for buybacks or strategic M&A.
- Catalyst 3: Re-rating as growth stabilizes and investors pay a higher multiple for quality packaging names.
Bull Target: $52 (+24%)
Bear Case
- Risk 1: High leverage and a current ratio under 1 could pressure liquidity if volumes or pricing deteriorate.
- Risk 2: Input cost volatility or lost pricing momentum compresses margins and hurts free cash flow.
- Risk 3: Cyclical end markets lead to a multiple reversion, leaving the stock rangebound or lower.
Bear Target: $30 (-28%)
Risks to Consider
- Valuation Risk: While headline multiples look reasonable, a further compression in multiple would limit upside given only modest consensus upside.
- Competitive Risk: Pricing pressure from competitors or a failure to commercialize sustainable packaging innovations could weigh on growth.
- Macro Risk: Demand softness in industrial or foodservice channels could reduce volumes and revenue visibility.
- Execution Risk: Failure to reduce leverage or convert margin gains into free cash flow would constrain capital allocation and investor confidence.
Bottom Line
Investment Verdict: NEUTRAL
Sealed Air presents a balanced risk reward. Data suggests the company has turned a corner operationally and is trading at a modest multiple, but the capital structure and liquidity metrics introduce nontrivial downside risk if the macro or customer demand softens. For you, the key questions are simple. Is the recent recovery durable and will management sustain cash flow and reduce leverage? Those answers will determine whether the stock re-rates or remains stuck near current levels.
Action Items for Investors
- Long-term investors: Track debt reduction, free cash flow trends and sustained margin expansion as prerequisites for a favorable reevaluation of the stock.
- Short-term traders: Watch price action around $44 for a breakout and the May 4 earnings print for near term volatility and directional cues.
- Risk management: Monitor working capital indicators and access to committed credit, and size exposure with the balance sheet risk in mind.
What to Watch This Week
- Analyst notes and updates on pricing, especially from large coverage firms that set forward expectations.
- Industry data on packaging demand and input cost trends such as resin and freight pricing.
- Company commentary on capital allocation and any updates before the May 4 earnings release.
Sources
Share this report
Share this article
Spread the word on social media
Think SEE will outperform? Prove it.
Free practice contests — earn Alpha CoinsExplore More Content
Disclaimer: StockAlpha.ai content is for informational and educational purposes only. It is not personalized investment advice. Sentiment ratings and market analysis reflect data-driven observations, not buy, sell, or hold recommendations. Always consult a qualified financial advisor before making investment decisions. Past performance does not guarantee future results.