HYFM: Micro-cap struggles, big execution risk
Hydrofarm ($HYFM) remains a volatile micro-cap with negative earnings, a tiny market cap, and an analyst consensus Sell. Revenue is meaningful, but losses, leverage and thin equity value keep downside risk elevated.
Executive Summary
Investment Thesis: Hydrofarm ($HYFM) operates in controlled-environment agriculture supply but is trading as a micro-cap with a market capitalization near $10 million while generating meaningful revenue, roughly $146M TTM. The balance sheet shows cash of about $10.6M and a current ratio above 2, but the company reports large net losses, negative EPS of $-14.06 and negative ROE. Market sentiment and sell-side coverage are pessimistic, reflecting execution questions and a compressed equity valuation.
Current Price: $1.19 | Key Metric: EPS (TTM) $-14.06 | Stance: BEARISH
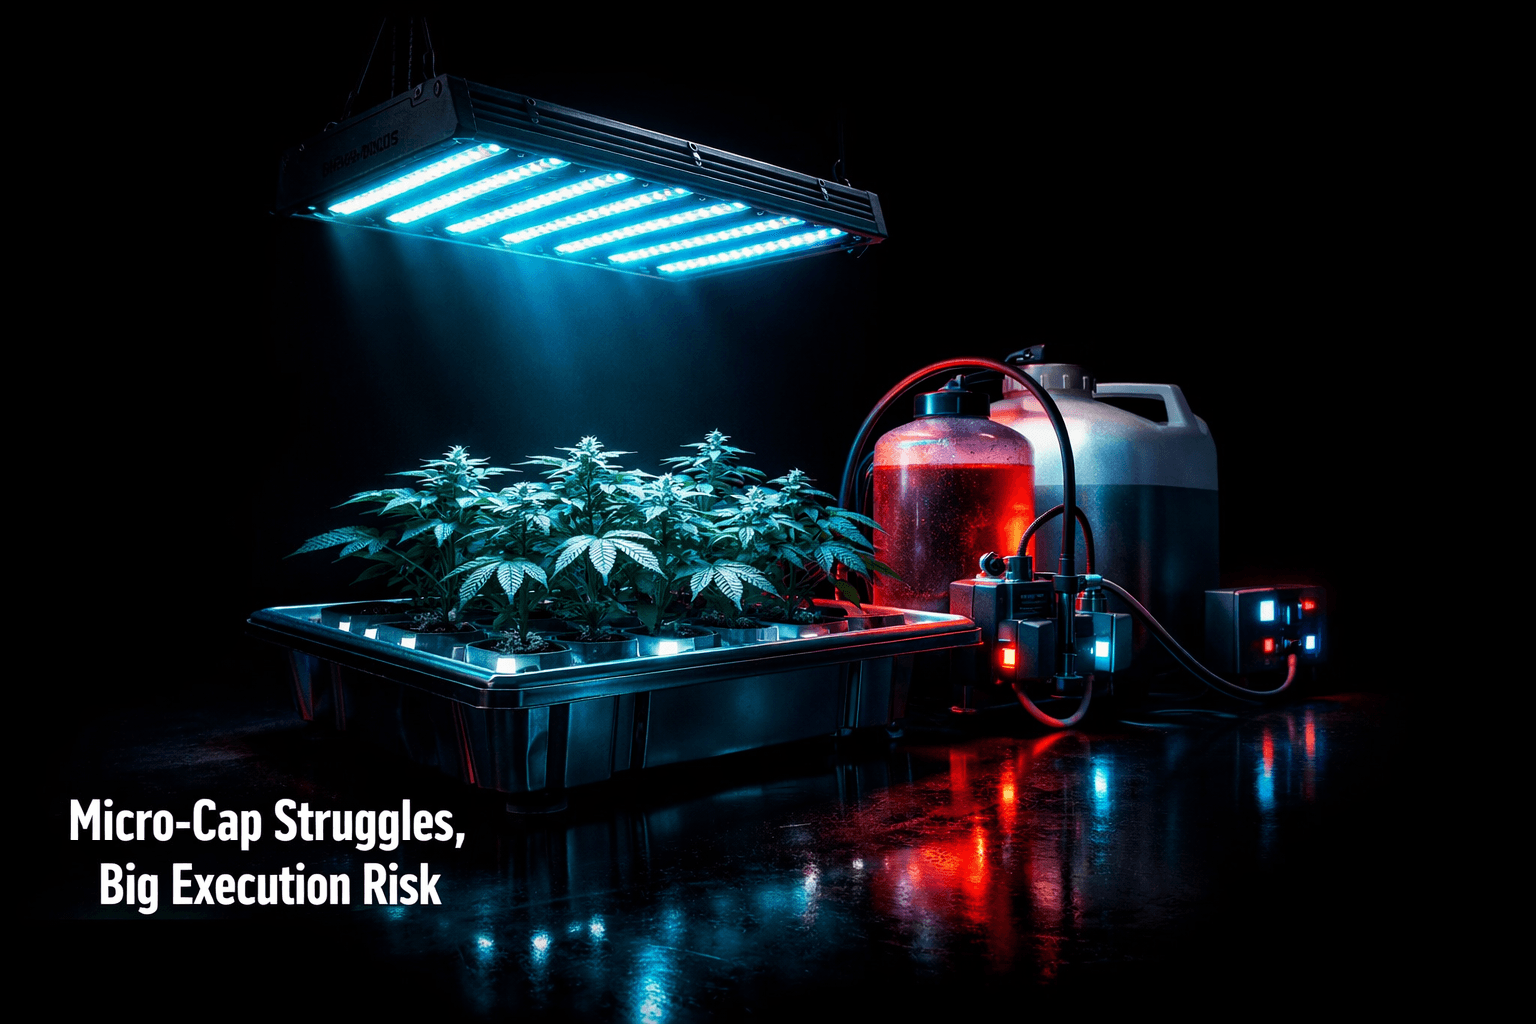
Company Overview
Hydrofarm Holdings Group Inc ($HYFM) is a distributor and manufacturer of controlled-environment agriculture products. The company supplies lighting, climate and irrigation systems, nutrients and hydroponic accessories to commercial growers and specialty retailers.
Key Products & Competitive Position
- Core Business: Distribution and branded manufacturing of horticultural equipment and supplies for indoor and greenhouse growers.
- Key Products: Grow lights, climate control systems, irrigation equipment, nutrients, and grow media.
- Competitive Moat: Broad product catalog and distribution network, scale with supplier relationships, and some proprietary branded products. The moat is limited by strong competition and low barriers to entry for many product categories.
Recent Developments
Hydrofarm has been operating under tight liquidity and earnings pressure, posting large net losses over the trailing twelve months. Management continues to focus on channel optimization and inventory management; meanwhile market attention centers on upcoming and recent quarterly reports. The stock remains highly volatile with a 52-week range from $0.86 to $4.78.
Financial Snapshot
Revenue & Earnings Trends
Hydrofarm reports trailing twelve-month revenue of roughly $146.4 million, indicating the company still moves material product volumes. Despite sales, profitability is negative with net income around -$65M TTM and EPS at -$14.06. Profit margin is deeply negative, near -44% on a trailing basis, which signals either elevated costs, markdowns, or integration write-offs if acquisitions have occurred.
Volume and revenue show resilience relative to a very low equity valuation, but earnings have yet to turn positive. That dynamic explains why equity investors assign a distressed valuation despite reasonable top-line activity.
Balance Sheet Highlights
Hydrofarm carries cash of about $10.6M and a current ratio around 2.08, suggesting near-term liquidity to operate through the next several quarters. However enterprise value is substantially higher than the market cap, driven by debt and other adjustments. Total debt to equity sits elevated at near 90% per most public data aggregates. The combination of low market cap and meaningful enterprise value raises equity risk if the company cannot restore profits or materially deleverage.
Valuation Analysis
Current Valuation Metrics
Historical Comparison
On a simple multiple basis, HYFM trades well below historical norms for healthy industrial distributors. Price to sales of ~0.04 is extremely compressed and below typical small-cap industrial peers. However the compression reflects structural earnings weakness and a nearly de minimis equity market value, so comparing multiples alone can be misleading.
Fair Value Estimate
Assigning a fair value is challenging because EPS is deeply negative and forward guidance is uncertain. A conservative framework values the business closer to asset and enterprise measures than to equity multiples. If Hydrofarm can restore modest profitability and generate positive EBITDA, a recovery toward even low single-digit P/S multiples or an equity value above current market cap is plausible. Absent a sustained earnings turnaround, the market appears to be pricing potential continued losses or restructuring outcomes into the share price.
Competitive Landscape
Market Position
Market Share: Small to mid-tier in indoor agriculture supplies | Ranking: Among many specialized distributors in the industry
Key Competitors
Competitive Advantages
- Moat 1: Broad product catalog and multi-channel distribution relationships, which support recurring orders.
- Moat 2: Recognized brands in some product lines that help maintain margins when inventory and supply chain are stable.
- Moat 3: Scale in certain product categories relative to niche competitors, enabling negotiated supplier terms when volumes normalize.
Earnings Track Record
Last 4 Quarters: 0 beats / 4 misses
Recent Earnings History
Guidance Trend
Management has not delivered consistent positive guidance, and consensus forecasts remain cautious. The next liquidity and margin signals will come from the company’s ability to move from negative margins to breakeven on an adjusted basis. Investors are watching upcoming quarterly releases for evidence of stabilization.
Analyst Sentiment
Consensus Rating:
Price Targets
- Low: N/A
- Mean: N/A (coverage is limited and targets were not reported)
- High: N/A
Recent Analyst Actions
Coverage is thin, with six analysts recorded in aggregate data and a consensus leaning to Sell. There have been limited positive-rated actions in recent periods. Analysts note cash runway and margin recovery as key elements for any positive revision.
Recent News & Catalysts
Key Developments
- Q4 2025 Earnings (Reported March window): Company reported continued losses and negative EPS, which reinforced cautious analyst views.
- Balance Sheet Update: Cash was reported around $10.6M with a current ratio ~2.08, suggesting near-term liquidity is manageable but not ample given the company's enterprise obligations.
- Stock Volatility: Price has swung between $0.86 and $4.78 over the past year, reflecting sentiment-driven moves and thin equity liquidity.
Upcoming Catalysts
Next Earnings: Q1 2026 expected 2026-05-11 Before Market | Key Events: margin trajectory, inventory turns, any restructuring announcements, and commentary on debt or asset sales.
Technical Outlook
Current Price: $1.19 vs 52-Week High: $4.78 (-75.1% from high)
Trend Analysis
The trend is down over the longer term from the 2025 peak. Recently the stock has traded in a low-price range and has been volatile. Beta around 2.47 indicates above-market volatility, so price swings can be large relative to peers. Short-term momentum indicators have favored sellers on recent sessions, reflected in intraday swings and a lower close versus the prior day.
Key Levels
- Resistance: $1.50, $2.50
- Support: $1.00, $0.86
Bull vs Bear Case
Bull Case
- Catalyst 1: Margin recovery through tighter inventory and cost control, pushing to breakeven and then positive EBITDA.
- Catalyst 2: Asset rationalization or a strategic sale could sharply increase equity value relative to current market cap.
- Catalyst 3: Market re-rating if the company demonstrates consistent sequential improvements in gross margin and operating leverage.
Bull Target: $2.50 (+110% from current price)
Bear Case
- Risk 1: Continued operating losses exhaust cash and force dilutive financing or asset sales that leave equity holders with minimal value.
- Risk 2: Competitive pricing pressure and channel consolidation reduce market share and depress margins further.
- Risk 3: Thin market cap relative to enterprise obligations makes the stock vulnerable to downward price shocks and limited liquidity, compounding downside volatility.
Bear Target: $0.60 (-49.6% from current price)
Risks to Consider
- Valuation Risk: Equity trades at a nominal market capitalization, which implies high sensitivity to any financing or asset events. Small dollar moves can represent large percentage changes for holders.
- Competitive Risk: Numerous distributors and manufacturers target the same end markets, and pricing competition can erode margins quickly in commoditized product segments.
- Macro Risk: End demand for indoor agriculture equipment can be cyclical and tied to broader capital expenditure trends; macro slowdowns could hit orders and inventory turns.
- Execution Risk: Management needs to restore consistent profitability, manage working capital, and avoid dilutive financings. Failure to do so increases bankruptcy or restructuring risk.
Bottom Line
Investment Verdict: BEARISH
Data suggests HYFM remains a distressed small-cap equity. You can see material revenue, but earnings and cash generation have been negative, and the market price reflects significant execution and liquidity risk. Analysts are largely negative and coverage is thin. For many investors, the risk/reward profile is skewed to downside until the company shows clear, repeatable profitability or a credible balance sheet repair plan.
Action Items for Investors
- Long-term investors: Monitor quarterly margins, cash flow, and any restructuring announcements. Consider exposure only if you can tolerate high volatility and the potential for dilution.
- Short-term traders: Watch support at $1.00 and $0.86 and trade around volatility. Volume spikes on news events can present short-term opportunities, but risk controls are essential.
- Risk management: Use position sizing disciplined for micro-cap risk, set stop-loss levels, and avoid overexposure given thin liquidity and high beta.
What to Watch This Week
- Any follow-up disclosures or commentary from the company on Q4 2025 results and Q1 2026 outlook.
- Cash and liquidity updates, including working capital and debt covenants if discussed.
- News on asset sales, strategic alternatives, or financing announcements that could materially change equity value.
Sources
Share this report
Share this article
Spread the word on social media
Think HYFM will outperform? Prove it.
Free practice contests — earn Alpha CoinsExplore More Content
Disclaimer: StockAlpha.ai content is for informational and educational purposes only. It is not personalized investment advice. Sentiment ratings and market analysis reflect data-driven observations, not buy, sell, or hold recommendations. Always consult a qualified financial advisor before making investment decisions. Past performance does not guarantee future results.