
Key Takeaways
- Candlesticks display four price points (open, high, low, close) and pattern context matters more than any single candle.
Introduction
Candlestick patterns are visual formations on price charts built from single or multiple candles that many traders use to infer short-term shifts in supply and demand. Originating in 18th-century Japanese rice markets, modern traders use candlesticks to read price action quickly and make timing decisions for entries and exits.
For intermediate traders, candlesticks are most valuable when combined with context: trend direction, support/resistance, and volume. This article explains key candlestick shapes and multi-candle patterns, shows how traders interpret them, and gives concrete examples using real tickers.
You'll learn: how to read candles, which reversal and continuation patterns matter most, practical trade rules (confirmation, stops, targets), and common mistakes to avoid. Examples reference $AAPL, $TSLA, $NVDA, and $AMZN to make patterns tangible.
How Candlesticks Work: Basics and Context
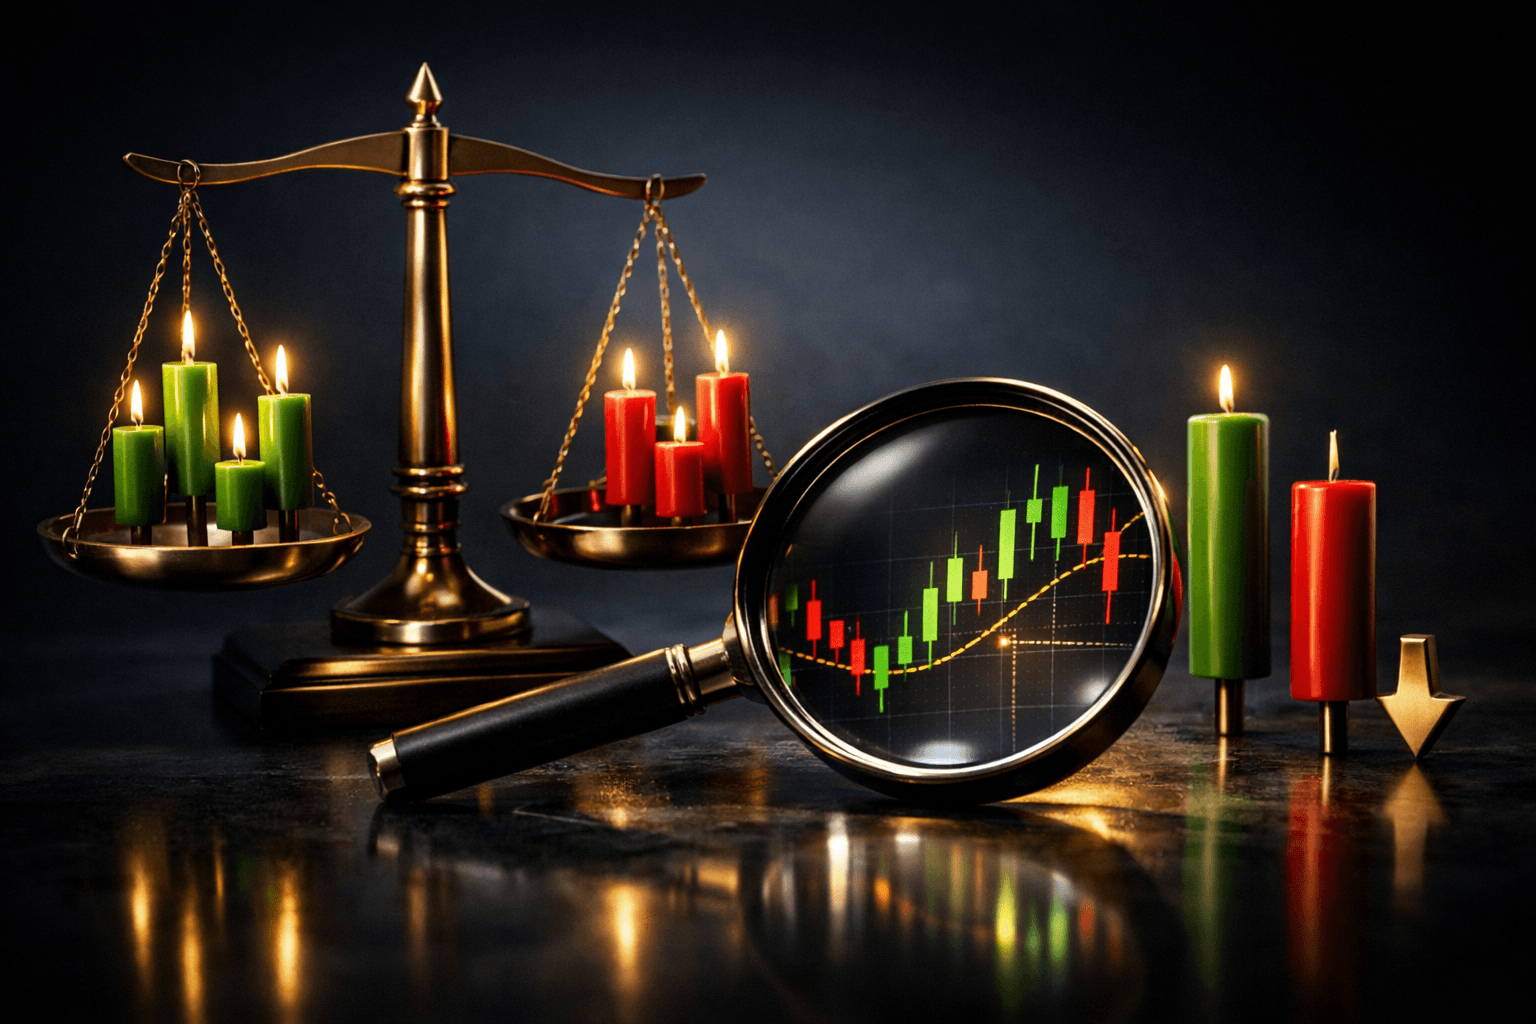
A candlestick has four data points: open, high, low, and close. The body (open to close) shows net direction; wick/shadow (high-low) shows intraperiod extremes. Color convention varies, but the key is whether close is above (bullish) or below (bearish) the open.
Always read candles in context. A bullish hammer in a downtrend close to a known support level carries more weight than the same hammer in the middle of a trading range. Volume and higher-timeframe trend further strengthen or weaken signals.
Single-candle vs multi-candle patterns
Single-candle patterns (doji, hammer, shooting star) often indicate indecision or a quick rejection of price. Multi-candle patterns (engulfing, harami, three methods) incorporate a short sequence and usually provide stronger evidence because they show how buyers and sellers acted over several periods.
Key contextual filters
- Trend: Is price in a clear uptrend, downtrend, or range on the higher timeframe?
- Support/resistance: Does the candle form at a horizontal level, moving average, or trendline?
- Volume: Higher volume on a reversal candle adds conviction.
- Confirmation: Follow-up price action (next candle closes above/below the trigger) boosts reliability.
Common Reversal Patterns: What to Watch For
Reversal patterns suggest a potential change in trend direction. Below are the most useful intermediate-level formations and what they commonly indicate.
Hammer and Hanging Man
Both have small bodies and long lower shadows. In a downtrend, a hammer shows rejection of lower prices and can signal a bullish reversal if confirmed by a higher close or increased volume the next day. In an uptrend, the exact shape is called a hanging man and can signal a top if followed by weakness.
Example: If $AAPL is down 8% over several sessions and forms a hammer at prior support on increased volume, traders watch for a next-day close above the hammer's high as confirmation.
Shooting Star and Inverted Hammer
These have long upper shadows with small bodies. A shooting star in an uptrend points to rejection of higher prices and can be a bearish reversal if the following candle confirms. An inverted hammer at a downtrend low is the bullish counterpart.
Doji
A doji has nearly equal open and close and signals indecision. On its own a doji is ambiguous; it's most meaningful when it appears at an extreme (support or resistance) and is followed by a directional breakout. Types include the long-legged doji and dragonfly/doji.
Bullish and Bearish Engulfing
An engulfing pattern consists of two candles where the second completely 'engulfs' the prior candle's body. A bullish engulfing after a downtrend indicates strong buying pressure; a bearish engulfing after an uptrend suggests selling dominance.
Example: $TSLA downtrend daily forms a small red day followed by a large green day that engulfs it. Traders look for the next day's high to exceed the engulfing candle's high as a confirmation trigger.
Continuation and Complex Patterns
Continuation patterns signal a temporary pause in a trend before the prior trend resumes. These are useful for trend-following traders who want to add positions or avoid getting shaken out.
Rising and Falling Three Methods
In a rising three methods (bullish continuation), a long white candle is followed by several small-bodied candles that stay within the range of the first candle, and then another long white candle closes above the first. This pattern indicates a brief consolidation before buyers return.
Harami and Harami Cross
A harami is a two-candle pattern where a small body sits within the prior larger body. A bullish harami in a downtrend suggests the selling pressure is waning. A harami cross uses a doji as the small body and often signals stronger indecision and a possible reversal or pause.
Three White Soldiers / Three Black Crows
Three consecutive long-bodied candles in the direction of the trend (soldiers for uptrend, crows for downtrend) indicate strong momentum continuation or a powerful reversal if they appear against the prior trend. Volume that increases across the sequence adds conviction.
How Traders Use Patterns: Rules, Confirmation, and Risk
Patterns are not trade signals on their own. Successful traders use rules to convert patterns into a repeatable edge. Below are practical execution steps and risk-management guidelines.
- Confirm context: Verify the higher-timeframe trend and check for nearby support/resistance or moving averages.
- Wait for confirmation: For reversals, require the next candle to close above/below the reversal candle's high/low. For continuations, require the breakout candle to close beyond the consolidation range.
- Define risk: Place a stop just beyond the pattern extreme (e.g., below the hammer's low or above a shooting star's high).
- Plan position size: Use dollar-risk per trade based on stop distance and portfolio risk tolerance (commonly 0.5, 2% of capital).
- Set targets: Use measured moves, prior structure, or reward-to-risk ratios (2:1 or greater) to pick profit targets, and consider scaling out on strength.
Example trade setup
Suppose $NVDA is in a short-term pullback and daily price forms a bullish engulfing candle at a 50-day moving average. Confirmation is a close above the engulfing high. Place a stop below the engulfing low. If the entry-to-stop distance is $6 and you risk $600, position size equals 100 shares. Target could be prior swing high or a 2:1 reward of $12.
Using volume and multiple timeframes
Volume that rises on the confirming candle typically strengthens the signal; thin volume often produces false breakouts. Check higher timeframes, if a daily bullish pattern aligns with weekly support, the trade has stronger odds.
Real-World Examples (Illustrated Scenarios)
Below are realistic scenarios showing how traders might apply patterns with numbers and outcomes.
$AAPL Hammer Reversal
$AAPL declines from 180 to 160 over ten sessions and forms a hammer at 160 with a long lower wick and a small green body. Volume spikes 35% above the 20-day average. Trader waits for a next-day close above 163 (hammer high) as confirmation and sets a stop at 157 (below the wick). Entry at 164, stop 157, risk $7 per share. If target is prior support-turned-resistance at 180, reward is $16 (roughly 2.3:1).
$AMZN Bearish Engulfing Failure
$AMZN rallies to 140 then prints a large red engulfing candle. Some traders short on the engulfing, but price stalls and fails to close below the engulfing low on the next day, volume is low. The signal fails and price resumes upward, illustrating the importance of confirmation and volume filters.
$TSLA Rising Three Methods Continuation
$TSLA shows a long green candle followed by three small candles within its range, then another green candle that closes above the initial candle's high. Traders interpreting this as continuation may add to positions on a breakout with stops beneath the small-candle cluster, treating it as a trend-following add.
Common Mistakes to Avoid
- Ignoring context: Trading a hammer or engulfing candle without checking trend or nearby support/resistance increases false signals. Always confirm context.
- Relying on one candle: Candlestick patterns are probabilistic. Use confirmation and filters (volume, higher timeframe) before committing capital.
- Poor stop placement: Placing stops too tight leads to frequent stop-outs; too wide increases position size risk. Calculate stops based on clear pattern extremes and risk tolerance.
- Overtrading small timeframes: Patterns on one-minute or tick charts produce many low-quality signals. Prefer daily or 4-hour charts for more reliable setups.
- Ignoring volume and market regime: Low-volume environments and high-volatility news events can invalidate typical pattern behavior. Avoid trading noisy sessions without adjustments.
FAQ
Q: How reliable are candlestick patterns for predicting reversals?
A: Candlestick patterns are probabilistic signals, not certainties. Their reliability improves when used with trend context, support/resistance, volume confirmation, and higher-timeframe alignment. Expect false signals and manage risk accordingly.
Q: Which timeframe is best for candlestick analysis?
A: For swing and position trading, daily and weekly charts are most reliable. For shorter-term trading, 4-hour and 1-hour charts can work but require tighter rules and awareness of noise. Avoid relying solely on very low timeframes for major decisions.
Q: Can candlestick patterns be automated in screeners?
A: Yes. Many platforms can scan for patterns like engulfing or doji. However, automated scans should include filters for context (moving averages, volume, trend) because raw pattern detection without context produces many false positives.
Q: Should I use candlesticks alone or combine with indicators?
A: Combining candlesticks with indicators (e.g., moving averages, RSI, VWAP) often improves decision-making. Use indicators to confirm momentum, trend, or overbought/oversold conditions, but avoid crowding your chart with redundant signals.
Bottom Line
Candlestick patterns are a practical way to read short-term shifts in market sentiment, but they work best as part of a structured trading process. Focus on context, confirmation, volume, and clear risk management to convert visual patterns into tradable setups.
Start by mastering a few high-probability patterns (hammer, doji, engulfing, three methods), practice identifying them across timeframes, and backtest your rules on historical data. Define entries, stops, and targets before trading, and treat candlesticks as one tool in a broader price-action toolkit.


