
Soxs Falls -13.82% in the Last Trading Day - Apr 25
Share this article
Spread the word on social media
The Big Picture
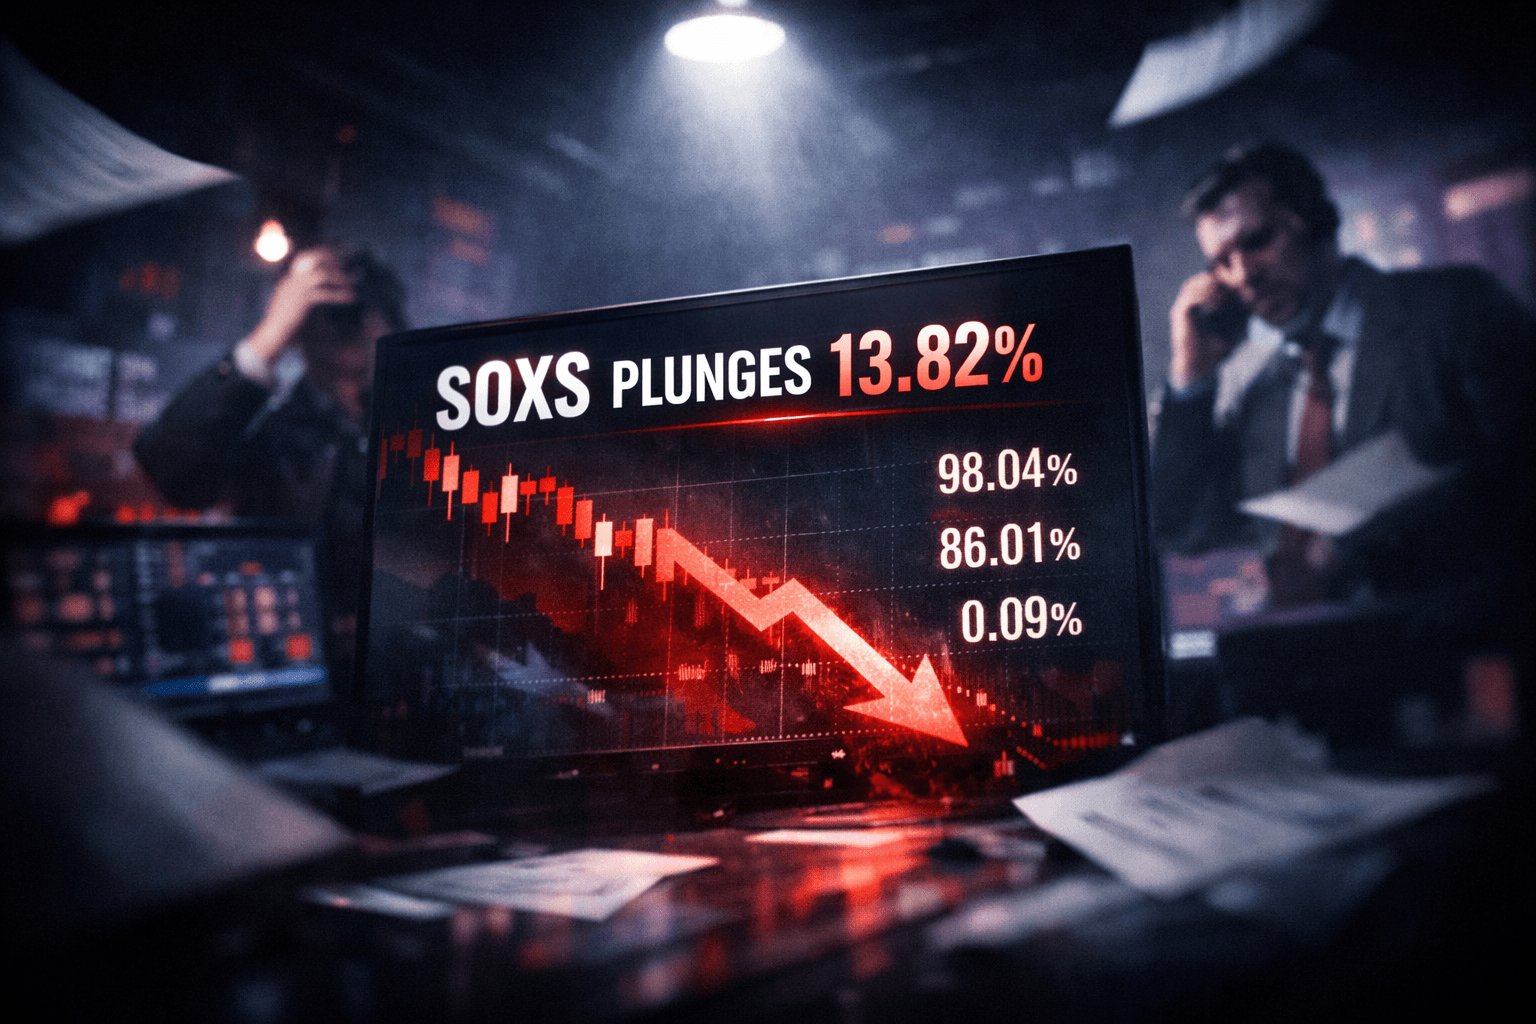
$SOXS plunged 13.82% to $13.53 as of Friday, Apr 24, a sharp move that signals heavy selling pressure heading into the long weekend. That drop occurred on unusually large volume, and it raises near-term volatility and capital-risk considerations for holders and traders.
For investors, the takeaway is simple: the decline materially changes short-term risk-reward and should prompt a recheck of position sizing, exposure, and valuation inputs before the next session.
What's Happening
The headline action is the one-day price move and the volume behind it. Below are the concrete data points reported for the last trading day and why they matter.
- Price change: down 13.82%, closing at $13.53 as of Friday, Apr 24, the primary reference for traders and portfolio mark-to-market.
- Trading volume: 228.36 million shares, indicating elevated participation and potential liquidity-driven moves.
- Additional context metrics available for analysis: 98.04%, 86.01%, 0.09% — these figures can be used in valuation or sensitivity checks.
- Relative activity: $SOXS was listed among the most actively traded securities in the last trading day, underscoring broad investor attention.
Compare this to typical sessions where volume and moves are much smaller; the combination of a double-digit drop and heavy turnover suggests more than routine profit-taking. Investors using these data points can update valuation models and stress tests to see how sensitive positions are to large intraday swings.
Why It Matters For Your Portfolio
The sudden 13.82% slide alters the immediate profile of exposure to $SOXS. For anyone with positions, the move affects realized and unrealized gains, margin requirements, and volatility assumptions used in portfolio construction.
Who should care: short-term traders and tactical allocators who track high-volume moves, and longer-term investors who must reassess volatility assumptions. Analysts' commentary was not provided in the source, so you should rely on the raw numbers and your risk framework when deciding next steps.
Risks To Consider
- Amplified Near-Term Volatility: Large one-day declines can precede further rapid moves, increasing the risk of stop-triggered selling for leveraged or concentrated positions.
- Liquidity Risk: While volume was high at 228.36M shares, rapid price moves can widen bid-ask spreads and make timely execution more costly for sizeable trades.
- Valuation Sensitivity: With additional data points of 98.04%, 86.01%, and 0.09% available, valuation models may show high sensitivity to input changes, creating larger model-driven revisions in fair-value estimates.
What To Watch Next
With markets closed on Saturday, the next actionable session is Monday. Monitor whether selling momentum eases or continues, and use the Friday figures as your baseline.
- Price reference: $13.53 is the last reported close to watch as an immediate benchmark.
- Volume trend: compare incoming session volume to Friday's 228.36M to gauge whether participation is cooling or intensifying.
- Valuation metrics: re-run models incorporating the provided figures 98.04%, 86.01%, and 0.09% to see how sensitive implied valuations are to shifts in assumptions.
- Market reaction: watch whether the security appears on high-activity lists again, which would suggest continuing investor focus.
Will selling pressure cool next week? That will depend on whether volume falls back and whether price stabilizes above the Friday close.
The Bottom Line
- $SOXS fell 13.82% to $13.53 as of Friday, Apr 24, on volume of 228.36M shares, marking a notable risk event for holders.
- High volume plus a double-digit drop increases short-term volatility and execution risk; reassess sizing and stop-loss rules accordingly.
- Use the available metrics (98.04%, 86.01%, 0.09%) to stress-test valuation and scenario analyses before adding or trimming exposure.
- Monitor price and volume early in the next trading session to see if the move represents a one-off selloff or the start of a sustained trend.
- Information presented here is for analysis only, and not a recommendation to buy or sell any security.
FAQ
Q: What triggered the 13.82% decline?
A: The source reports the price and volume data but does not provide a cause. The decline was accompanied by heavy trading, which often reflects elevated selling or rebalancing activity.
Q: How should I use the numbers 98.04%, 86.01%, and 0.09%?
A: These figures were provided as additional context and can be incorporated into valuation checks, sensitivity tests, or scenario models to see how different inputs affect theoretical fair value.
Q: Is this a buying opportunity?
A: This report presents data and implications only. Analysts and investors should update risk parameters and valuation assumptions before considering any change in exposure.